Automatic Measuring of Height and Diameter of regular Fibre-Structures
|
Hello everyone.
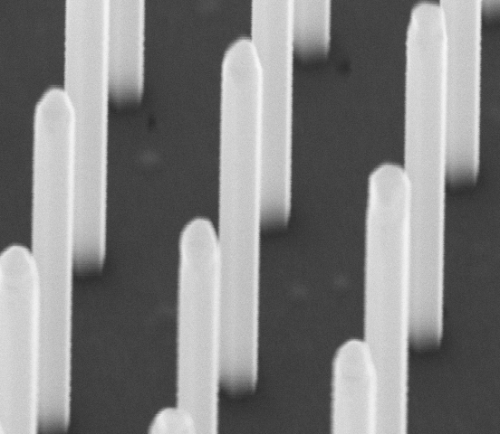
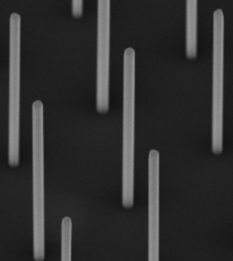
I am posting this topic, as I have not found the right answer to the following problem, though I think it lies within the scope of ImageJ. Comparable questions have already been posted in this forum, yet they were not exactly what I needed. As part of my MSc. Thesis, I am analysing Fibre-Structures such as the following by SEM:   I have to determine the height and diameter of each of these fibres. Using the "measure length" tool of ImageJ one by one is awful for large amount of these fibres, so I tried to let ImageJ automatically measure each fibre in parallel and get myself good statistics, not average values. So far I used the following steps to measure the fibres in the second picture (the one, where each fibre is separated and not overlapping with another): - Image -> Type -> 8bit - Image -> Adjust -> Threshold (which separates the dark underground from the light fibres) - Analyse -> Set Scale - Analyse -> Set Measurements -> Bounding Rectangle - Analyse -> Analyse Particles (I set a small minimum size to get rid of any small particles which are obviously not a fibre and also the outlines for control) This gives me quite good results for the height (height of the bounding rectangle) and for the diameter (width of the bounding rectangle), if the fibres are aligned vertically in the picture and if they are not overlapping. My problem is the first picture: How can I make use of the small contrast difference between two fibres and separate them easily so that ImageJ recognises them individually? I know, that for particles in binary pictures you can use "watershed", or you can use the "Grayscale Morphology" PlugIn to enhance contrast to the underground, but I do not know how to separate two fibres or more. I hope, that you can help me, as I think this problem is faced in many research areas. Thank you very much, Yours, Fabian |
Re: Automatic Measuring of Height and Diameter of regular Fibre-Structures
|
On Wednesday 29 Sep 2010 09:27:02 Fabian wrote:
> I am posting this topic, as I have not found the right answer to the > following problem, though I think it lies within the scope of ImageJ. > Comparable questions have already been posted in this forum, yet they were > not exactly what I needed. > > As part of my MSc. Thesis, I am analysing Fibre-Structures such as the > following by SEM: > > http://imagej.588099.n2.nabble.com/file/n5582589/ImageJ-ForumPublish.png > http://imagej.588099.n2.nabble.com/file/n5582589/ImageJ-ForumPublish2.png > > I have to determine the height and diameter of each of these fibres. > This gives me quite good results for the height I doubt it. You need to measure orthogonal to the longest axis of the object AND compensate for the distance to the object in the scene (note that the fibres that are far away are considerably shorter than those that appear closer in your 2nd image) OR you compensate the angle of the point of view and the distance to the object. (which comes to the same thing). What you are doing is like measuring the height of the Eiffel tower from high above in an airplane. The closer you get to the vertical axis of the tower, the shorter it appears in a 2D projection. Cheers Gabriel |
|
In reply to this post by Fabian
Hi Fabian,
as long as your fibers are arranged orthogonally, you could try the Plot Profile, which gives you information about both length (peak height) and diameter (peak width). If diagonal fiber clusters overlap, first isolate each cluster by outlining it and "clear outside", then create the profile. It should be possible to do this automatically with a few macro commands. Norbert |
Re: Automatic Measuring of Height and Diameter of regular Fibre-Structures
|
In reply to this post by Fabian
Hi Fabian,
for the sample image with fibres (nanorods?) behind each other, the Versatile Wand can separate them. Use a large value tolerance and a gradient tolerance of 3 or 4. http://imagejdocu.tudor.lu/doku.php? id=plugin:segmentation:versatile_wand:start It is not really automated; you have to click somewhere into the center of the fiber. A rough idea for an automated approach, it will need some refinement: If all fibers have bright edges, you could try using 'Find Maxima' for finding the brightest points of the edges, then see whether a point left or right of it is still inside a fiber (bright enough) and if it is not inside a fiber found previously, do the Versatile Wand operation there. Michael ________________________________________________________________ On 29 Sep 2010, at 08:02, Fabian wrote: > Hello everyone. > > I am posting this topic, as I have not found the right answer to the > following problem, though I think it lies within the scope of ImageJ. > Comparable questions have already been posted in this forum, yet > they were > not exactly what I needed. > > As part of my MSc. Thesis, I am analysing Fibre-Structures such as the > following by SEM: > > http://imagej.588099.n2.nabble.com/file/n5582589/ImageJ- > ForumPublish.png > http://imagej.588099.n2.nabble.com/file/n5582589/ImageJ- > ForumPublish2.png > > I have to determine the height and diameter of each of these > fibres. Using > the "measure length" tool of ImageJ one by one is awful for large > amount of > these fibres, so I tried to let ImageJ automatically measure each > fibre in > parallel and get myself good statistics, not average values. > > So far I used the following steps to measure the fibres in the second > picture (the one, where each fibre is separated and not overlapping > with > another): > - Image -> Type -> 8bit > - Image -> Adjust -> Threshold (which separates the dark > underground from > the light fibres) > - Analyse -> Set Scale > - Analyse -> Set Measurements -> Bounding Rectangle > - Analyse -> Analyse Particles (I set a small minimum size to > get rid of > any small particles which are obviously not a fibre and also the > outlines > for control) > > This gives me quite good results for the height (height of the > bounding > rectangle) and for the diameter (width of the bounding rectangle), > if the > fibres are aligned vertically in the picture and if they are not > overlapping. > > My problem is the first picture: > How can I make use of the small contrast difference between two > fibres and > separate them easily so that ImageJ recognises them individually? > > I know, that for particles in binary pictures you can use > "watershed", or > you can use the "Grayscale Morphology" PlugIn to enhance contrast > to the > underground, but I do not know how to separate two fibres or more. > > I hope, that you can help me, as I think this problem is faced in many > research areas. > Thank you very much, > Yours, > > Fabian |
|
Hello everyone.
At first thanks for the constructive answers. The "Versatile Wand" seems to be what I need, as the regular "wand tracing tool" always marked the whole fibre-line from the top of the picture to the bottom. I am not so sure about the "plot profile". It does the trick, but needs considerable effort to extract the actual diameters afterwards, not to forget, that you have to give lines for the program to follow. I will try to make a macro which will do the following, but I might need help with one or two of the steps. ROADMAP of the steps: 1) "Threshold" to get rid of the background and create sharp contrasts for the wand tool. 2) Automated "Versatile Wand" to separate any overlapping fibres. 3) Outline and labeling of the separated fibres. The way to go would be something like the "analyse particles" and "outline" method. It gives very good results, if the area threshold and circularity is set properly. 4) Fit an rectangle to the outlined fibres, which works indepentend of orientation of the fibres (unlike "bounding rectangle). I know "fit ellipses" exists, but it overestimates the longer site and underestimates the shorter one. 5) Gather long and short side of the fit 6)  I will keep you updated on how it goes and would appreciate any suggestions or comments or better roadmaps. Yours, Fabian |
«
Return to ImageJ
|
1 view|%1 views
| Free forum by Nabble | Edit this page |

