Colour removal
|
Hi,
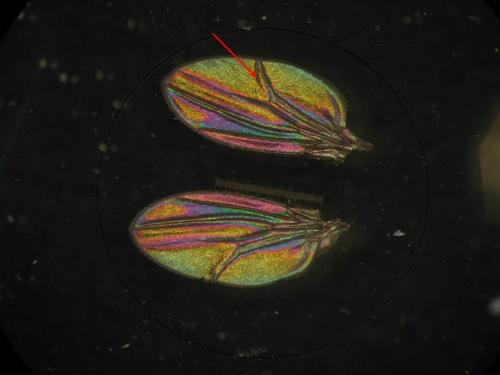
I'm new to ImageJ and am looking for some advice (possibly just a pointer to a relevant information source) for removing a colour range prior to calculating average HSB values for parts of an image. The image is a wing of a fruit fly  . The colours are made by interference patterns and are stable/repeatable within an individual fly. We want to quantify the average colour of different areas demarcated by the dark wing veins. Before doing this, we want to remove the dark areas (greys and blacks) that constitute the veins, folds in the wing when it was stuck on a slide for photographing (see red arrow in picture), and damage to the wing. I assume the approach would be to somehow binarize the image such that gray-black colours all end up black (or white), then remove these areas from the original image and proceed with our measurements. How this is done could have a big influence on the final measurements, so the method details are important. Image likely vary in brightness and in other ways as well (we have hundreds of them to process). Images are imported in RGB space, and the only previous research on this topic quantified average H, S and B of an area. Whether HSB is a better colour space in which to study the biological effects of colour variation (in this case on the mating success of the males - Q: are these colours used by females in choosing mates?) is never discussed, but is something I am also very curious about. . The colours are made by interference patterns and are stable/repeatable within an individual fly. We want to quantify the average colour of different areas demarcated by the dark wing veins. Before doing this, we want to remove the dark areas (greys and blacks) that constitute the veins, folds in the wing when it was stuck on a slide for photographing (see red arrow in picture), and damage to the wing. I assume the approach would be to somehow binarize the image such that gray-black colours all end up black (or white), then remove these areas from the original image and proceed with our measurements. How this is done could have a big influence on the final measurements, so the method details are important. Image likely vary in brightness and in other ways as well (we have hundreds of them to process). Images are imported in RGB space, and the only previous research on this topic quantified average H, S and B of an area. Whether HSB is a better colour space in which to study the biological effects of colour variation (in this case on the mating success of the males - Q: are these colours used by females in choosing mates?) is never discussed, but is something I am also very curious about.
As I said, any advice or redirect to a relevant source would be very much appreciated. Howard |
|
Hi Howard,
On Tue, Sep 15, 2015 at 6:25 PM, Howard <[hidden email]> wrote: [ on example image] ...< http://imagej.1557.x6.nabble.com/file/n5014344/wing.jpg> we want to remove the dark areas (greys and blacks) that constitute the veins...want to quantify the average colour of different areas demarcated by the dark wing veins...Image likely vary in brightness and in other ways...Whether HSB is a better colour space... is never discussed. if you subtract background, run("Subtract Background..."); You can threshold and segment the wings into 4 major regions each wing. Using the 'analyze particles' command, you can add these regions to the ROI manager run("Analyze Particles...", "size=100 show=Nothing exclude include add"); and for each ROI generate a Color Histogram. to measure the HSB Histogram, convert your image into HSB, then use run("HSB Stack"); run("Stack to RGB"); run("Color Histogram"); The subtract "Subtract Background..." should make it relatively robust against changes in background intensity. There are other options to pre-equalize intensity fluctuations. With only one image its difficult to say how much sense the measurements would make. I am happy to go into a second round with a small number of images that show the variance of the image quality. Kind regards, Jens Dr. Jens Rietdorf, visiting scientist @ center for technological development in health, Rio de Janeiro, Brazil. http://br.linkedin.com/pub/jens-rietdorf/6/4a3/189/ -- ImageJ mailing list: http://imagej.nih.gov/ij/list.html
Jens Rietdorf
Visiting Scientist
Fundação Oswaldo Cruz - Ministério da Saúde, Centro de Desenvolvimento Tecnológico em Saúde (CDTS), Rio de Janeiro, Brasil.
|
«
Return to ImageJ
|
1 view|%1 views
| Free forum by Nabble | Edit this page |

