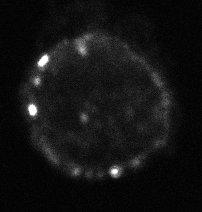
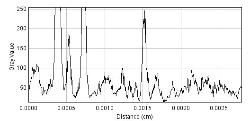
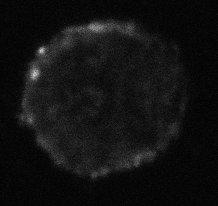
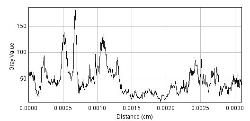
We have fluorescence labelling on the cell surface which in some cells is clustered in large bright foci but with a particular treatment the labelling is still in foci but they are less intense and smaller. We need some way of being able to quantify the difference. I have started by drawing a line following the cell membrane and plotting the intensity profiles but I'm unsure of the best way of quantifying the differences. I've added a couple of example images and associated plots.
Thanks in advance for your help!
Sonya


