Contour lines by density of particles
|
Hello everybody,
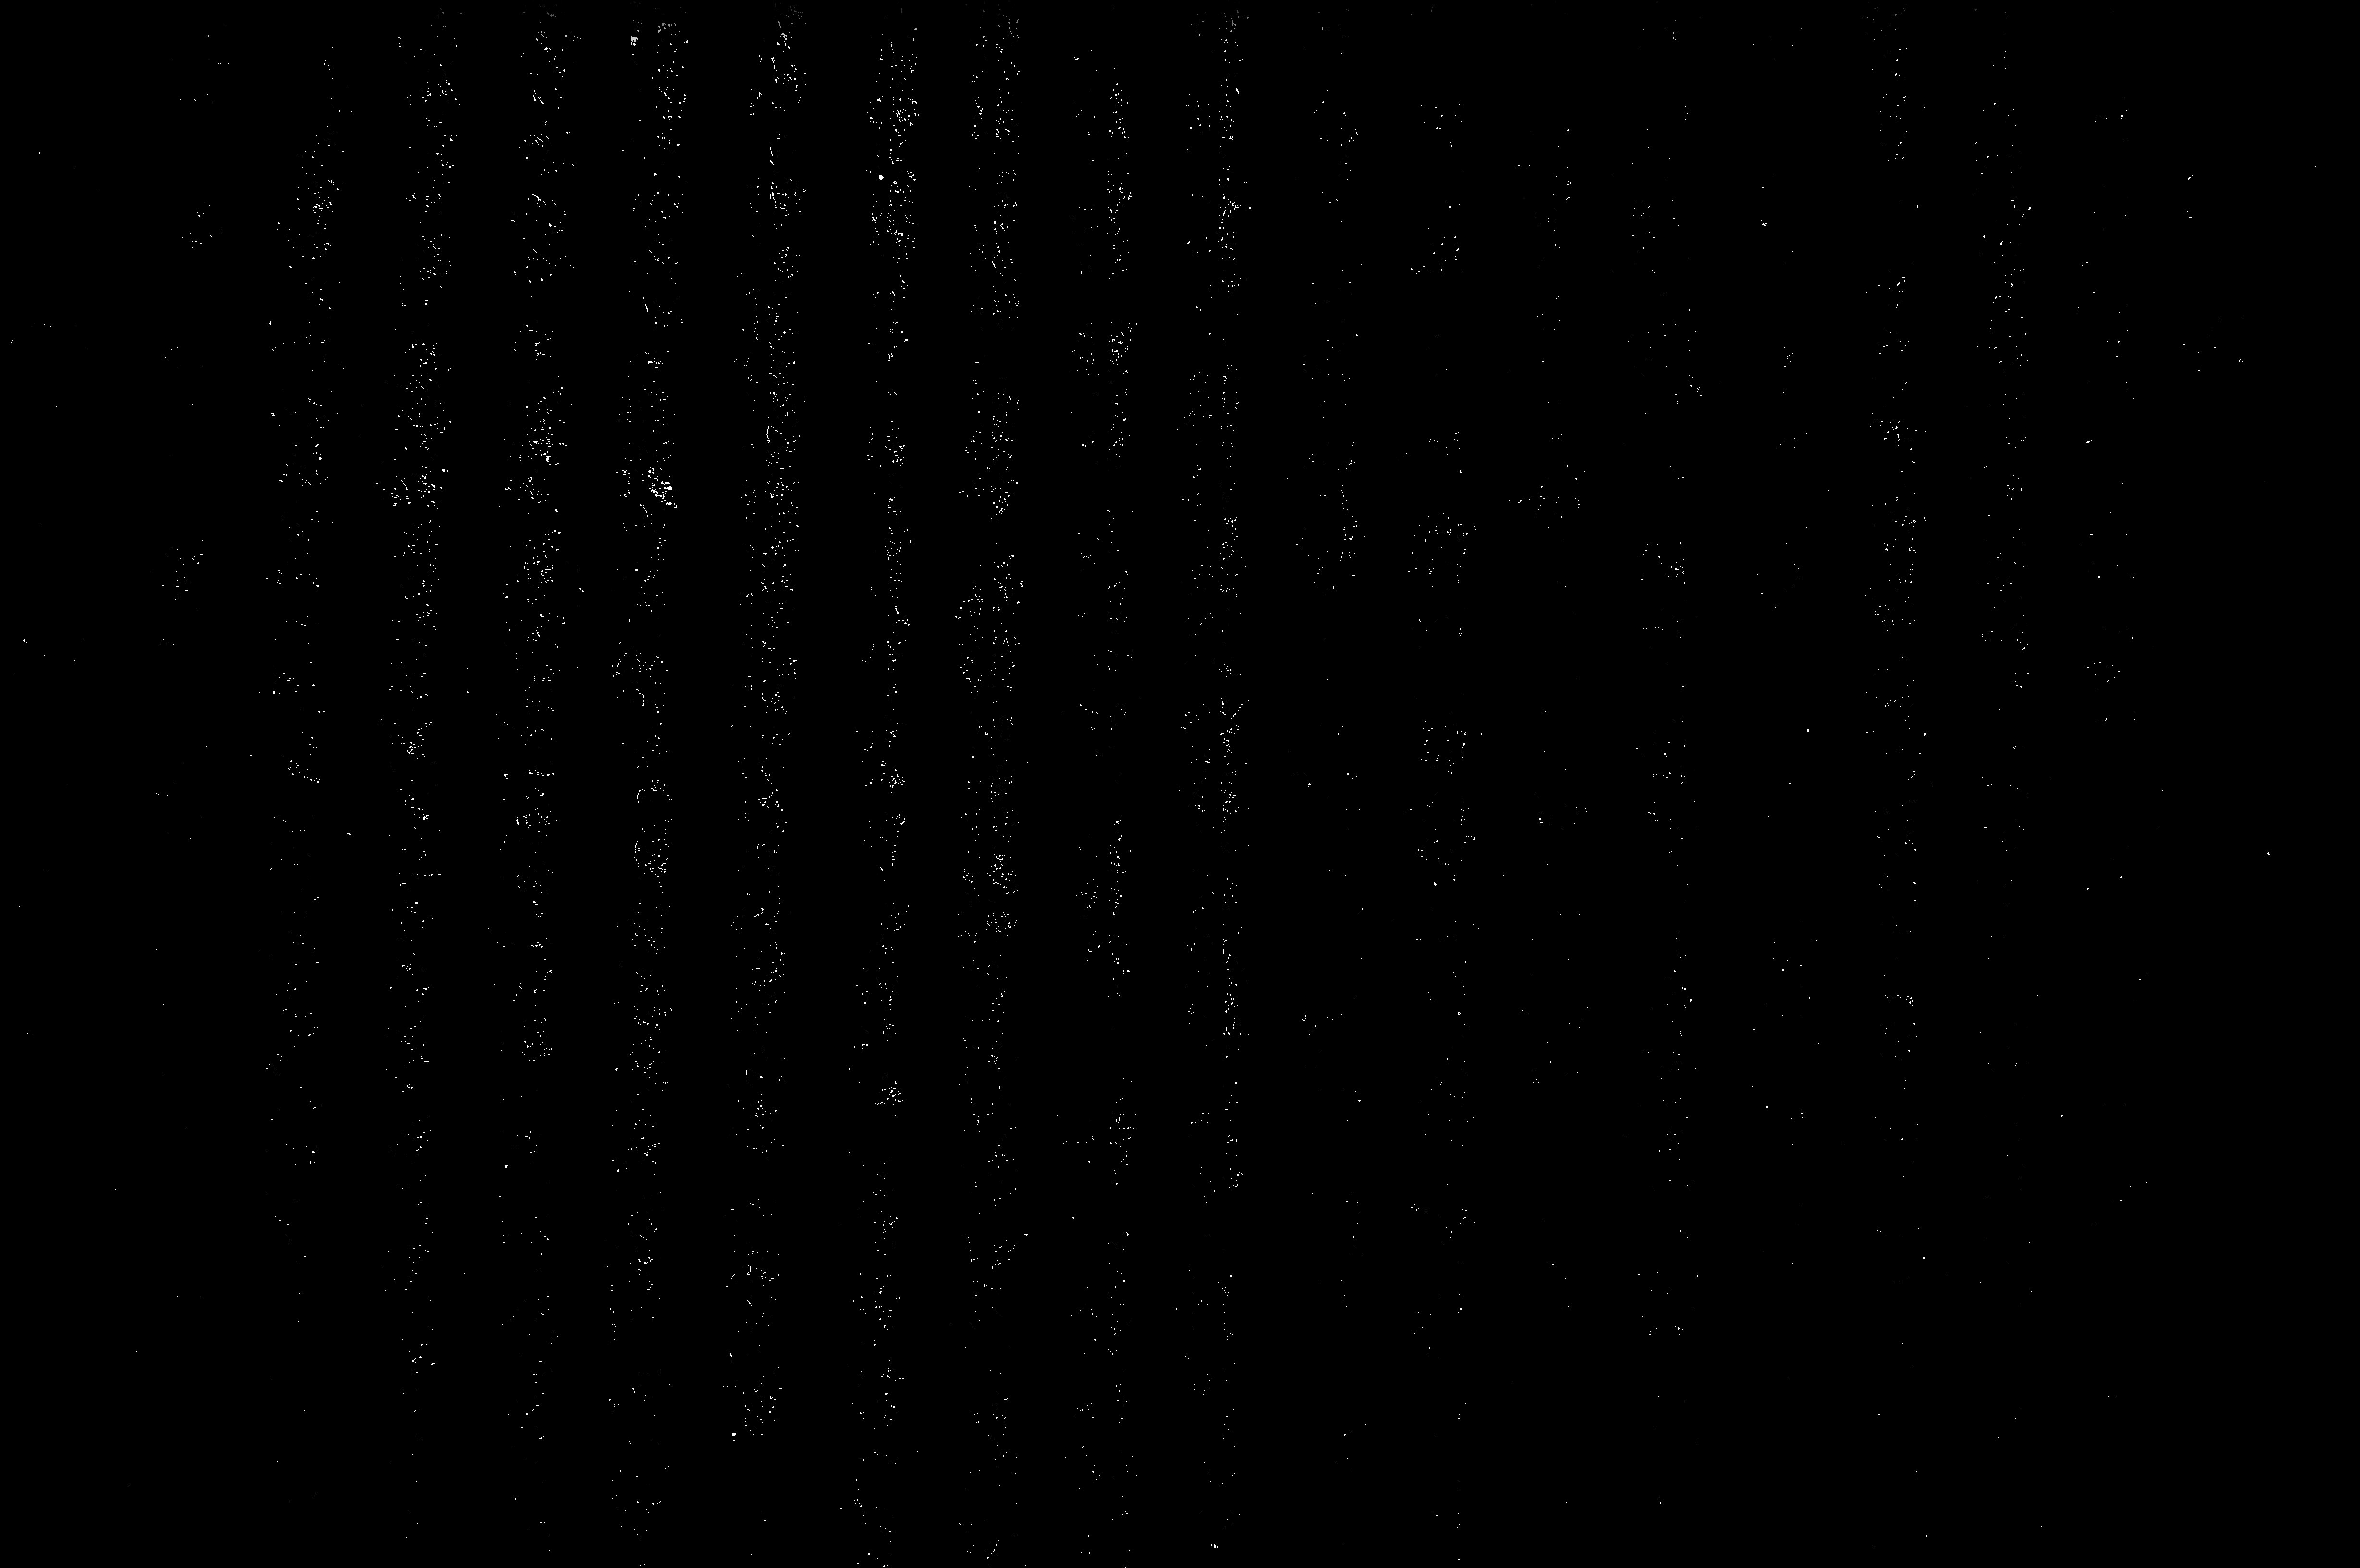
I'm working in a study to count particles on drone's image. After the threshold adjustment and the particles analysis, I want to represent the density of particles using the contour lines. Where the image has the highest density of particles I want to represented by a red color, where the image has the lowest density I want to represented by yellow. Thank you very much in advance for your help Josecito
Josecito
|
|
Josecito,
any solution depends on how you define and compute the particle density. Best Herbie :::::::::::::::::::::::::::::::::::::: Am 04.04.16 um 18:19 schrieb Josecito: > Hello everybody, > > I'm working in a study to count particles on drone's image. > > After the threshold adjustment and the particles analysis, I want to > represent the density of particles using the contour lines. > > Where the image has the highest density of particles I want to represented > by a red color, where the image has the lowest density I want to represented > by yellow. > > Thank you very much in advance for your help > > Josecito > > > > ----- > Josecito > -- > View this message in context: http://imagej.1557.x6.nabble.com/Contour-lines-by-density-of-particles-tp5016061.html > Sent from the ImageJ mailing list archive at Nabble.com. > > -- > ImageJ mailing list: http://imagej.nih.gov/ij/list.html > -- ImageJ mailing list: http://imagej.nih.gov/ij/list.html |
|
Hello,
We want to have the possibility to define de particle density (nb of particle / square pixels). For example :  the average particle is 5 pixels my density will be defined by an area of 50px x 50px or 100px x 100px The image has more than 8400 particles. With these parameters how can we represent the contour lines in colors in fonction of the density? Can we find a macro which can do this automatically ? Thanks for your help. Josecito.
Josecito
|
|
Josecito,
it seems that the particles are difficult to define. Can they overlap? How do you think you can count them? (Evidently you have to count them for getting "nb of particle / square pixels".) Best Herbie :::::::::::::::::::::::::::::::::::::: Am 08.04.16 um 18:29 schrieb Josecito: > Hello, > > We want to have the possibility to define de particle density (nb of > particle / square pixels). > > For example : > <http://imagej.1557.x6.nabble.com/file/n5016084/Count_Masks_of_DSC01054.jpg> > > the average particle is 5 pixels > my density will be defined by an area of 50px x 50px or 100px x 100px > > The image has more than 8400 particles. > > With these parameters how can we represent the contour lines in colors in > fonction of the density? > Can we find a macro which can do this automatically ? > > Thanks for your help. > > Josecito. > > > > > > > > > > > ----- > Josecito > -- > View this message in context: http://imagej.1557.x6.nabble.com/Contour-lines-by-density-of-particles-tp5016061p5016084.html > Sent from the ImageJ mailing list archive at Nabble.com. > > -- > ImageJ mailing list: http://imagej.nih.gov/ij/list.html > -- ImageJ mailing list: http://imagej.nih.gov/ij/list.html |
Re: Contour lines by density of particles
|
In reply to this post by Josecito
Hi Josecito,
One possible solution: - Find Maxima with single-point output (gives you 1 pixel per particle); assumes that particles do not overlap. - Convert to 32 bits and divide by 255. - Smooth with a method of your choice (e.g. Process>Filters>Mean) and large radius. The values will be in particles per pixel now. - Divide by the pixel area (in physical units, e.g. square meters) to get particles per area, if desired. Multiply by 50*50=2500 instead if you want to know the number of particles in an area of 50x50 pxl. - Use a Contour plotting plugin of your choice, e.g. http://rsb.info.nih.gov/ij/plugins/contour-plotter.html For the last step, you can also threshold the image at different levels, use 'Create Selection' and add all selections to the overlay or the ROI Manager. Michael ________________________________________________________________ On 2016-04-08 18:29, Josecito wrote: > Hello, > > We want to have the possibility to define de particle density (nb of > particle / square pixels). > > For example : > <http://imagej.1557.x6.nabble.com/file/n5016084/Count_Masks_of_DSC01054.jpg> > > the average particle is 5 pixels > my density will be defined by an area of 50px x 50px or 100px x 100px > > The image has more than 8400 particles. > > With these parameters how can we represent the contour lines in colors in > fonction of the density? > Can we find a macro which can do this automatically ? > > Thanks for your help. > > Josecito. -- ImageJ mailing list: http://imagej.nih.gov/ij/list.html |
«
Return to ImageJ
|
1 view|%1 views
| Free forum by Nabble | Edit this page |

