FRAP profiler bug ?
|
This post was updated on .
Dear All,
I tried to use the FRAP profiler plugin ( http://worms.zoology.wisc.edu/research/4d/4d.html#frap ) suggested on the Fiji website ( http://fiji.sc/Image_Intensity_Processing#FRAP_.28Fluorescence_Recovery_After_Photobleaching.29_Analysis ) and encounter some weird results when using the two-component exponential curve fitting on some dataset. So I tried to investigate the problem and rewrote partially the plugin in jython (just the two-component exponential curve fitting which is suppose to give a more accurate result). Here is the script:
import java.awt.Color as Color
from ij import WindowManager as WindowManager
from ij.plugin.frame import RoiManager as RoiManager
from ij.process import ImageStatistics as ImageStatistics
from ij.measure import Measurements as Measurements
from ij import IJ as IJ
from ij.measure import CurveFitter as CurveFitter
from ij.gui import Plot as Plot
from ij.gui import PlotWindow as PlotWindow
import math

# Get ROIs
roi_manager = RoiManager.getInstance()
roi_list    = roi_manager.getRoisAsArray()

# We assume first one is FRAP roi, the 2nd one is normalizing roi.
roi_FRAP    = roi_list[0];
roi_norm    = roi_list[1];

# Specify up to what frame to fit and plot.
n_slices = 23

# Get current image plus and image processor
current_imp  = WindowManager.getCurrentImage()
stack        = current_imp.getImageStack()
calibration  = current_imp.getCalibration()

#############################################

# Collect intensity values

# Create empty lists of number
If = []  # Frap values
In = []  # Norm values

# Loop over each slice of the stack
for i in range(0, n_slices):

    # Get the current slice
    ip = stack.getProcessor(i+1)

    # Put the ROI on it
    ip.setRoi(roi_FRAP)

    # Make a measurement in it
    stats = ImageStatistics.getStatistics(ip, Measurements.MEAN, calibration);
    mean  = stats.mean

    # Store the measurement in the list
    If.append( mean  )

    # Do the same for non-FRAPed area
    ip.setRoi(roi_norm)
    stats = ImageStatistics.getStatistics(ip, Measurements.MEAN, calibration);
    mean = stats.mean
    In.append( mean  )

# Gather image parameters
frame_interval = calibration.frameInterval
time_units = calibration.getTimeUnit()
IJ.log('For image ' + current_imp.getTitle() )
IJ.log('Time interval is ' + str(frame_interval) + ' ' + time_units)

# Find minimal intensity value in FRAP and bleach frame
min_intensity = min( If )
bleach_frame = If.index( min_intensity )
IJ.log('FRAP frame is ' + str(bleach_frame+1) + ' at t = ' + str(bleach_frame * frame_interval) + ' ' + time_units )

# Compute mean pre-bleach intensity
mean_If = 0.0
mean_In = 0.0
for i in range(bleach_frame):         # will loop until the bleach time
    mean_If = mean_If + If[i]
    mean_In = mean_In + In[i]
mean_If = mean_If / bleach_frame
mean_In = mean_In / bleach_frame

# Calculate normalized curve
normalized_curve = []
for i in range(n_slices):
    normalized_curve.append( (If[i] - min_intensity) / (mean_If - min_intensity)   *   mean_In / In[i] )

x = [i * frame_interval for i in range( n_slices ) ]
y = normalized_curve

xtofit = [ i * frame_interval for i in range( n_slices - bleach_frame ) ]
ytofit = normalized_curve[ bleach_frame : n_slices ]

# Fitter
fitter = CurveFitter(xtofit, ytofit)
#Double Exponential
eqn = "y = a*(1-exp(-b*x)) +c*(1-exp(-d*x)) + e"
fitter.doCustomFit(eqn, None, False)
IJ.log("Fit FRAP curve by " + fitter.getFormula() )
param_values = fitter.getParams()

# Overlay fit curve, with oversampling (for plot)
xfit = [ (t / 10.0  + bleach_frame) * frame_interval for t in range(10 * len(xtofit) ) ]
yfit = []
for xt in xfit:
    yfit.append( fitter.f( fitter.getParams(), xt - xfit[0]) )

plot = Plot("Normalized FRAP curve for " + current_imp.getTitle(), "Time ("+time_units+')', "NU", [], [])
plot.setLimits(0, max(x), 0, 1.2 );
plot.setLineWidth(2)

plot.setColor(Color.BLACK)
plot.addPoints(x, y, Plot.LINE)
plot.addPoints(x,y,PlotWindow.X)

plot.setColor(Color.RED)
plot.addPoints(xfit, yfit, Plot.LINE)

plot.setColor(Color.black)
plot_window =  plot.show()

# Output FRAP parameters
IJ.log("a:"+str(param_values[0])+";  "+"b:"+ str(param_values[1]) + ";  " +"c:"+ str(param_values[2])+";  "+"d:"+ str(param_values[3]) +";  "+"e:"+ str(param_values[4]))
thalf = math.log(2) / param_values[1]
thalf2 = math.log(2) / param_values[3]
mobile_fraction = param_values[0] + param_values[2]
str1 = ('Half-recovery time 1 = %.2f ' + time_units) % thalf
IJ.log( str1 )
str2 = ('Half-recovery time 2 = %.2f ' + time_units) % thalf2
IJ.log( str2 )
str3 = "Mobile fraction = %.1f %%" % (100 * mobile_fraction)
IJ.log( str3 )
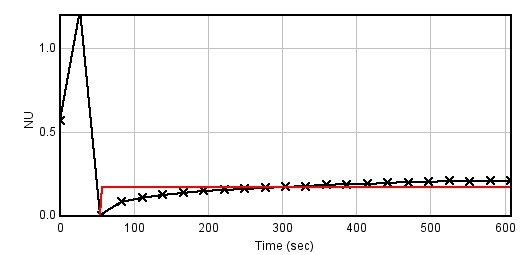
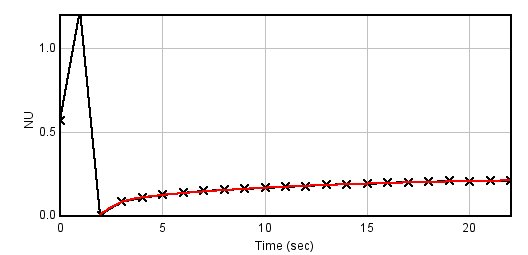
I ran this plugin on a FRAP stack ( http://bioimagingcore.be/images/frap.tif ) with the ROI set ( http://bioimagingcore.be/images/RoiSet.zip ), and you can see that the fitting result is wrong (red curve is the fitting over the black one which display the original values).  If now the Frame interval value in the Image>Properties (from the original one which is 27.61 sec) is set to 1 sec, then the fitting is right (see below)  So it make me think that something could be wrong in the CurveFitter fit method, which makes the output values of the FRAP profiler plugin wrongs. One way to fix the macro/plugin will be to set the time value to 1, then do the fit and multiply the output halftime by the real value. But I do not really understand why the fitting is failing. Benjamin |
«
Return to ImageJ
|
1 view|%1 views
| Free forum by Nabble | Edit this page |

