Help concerning Temperature Map
|
Hello!
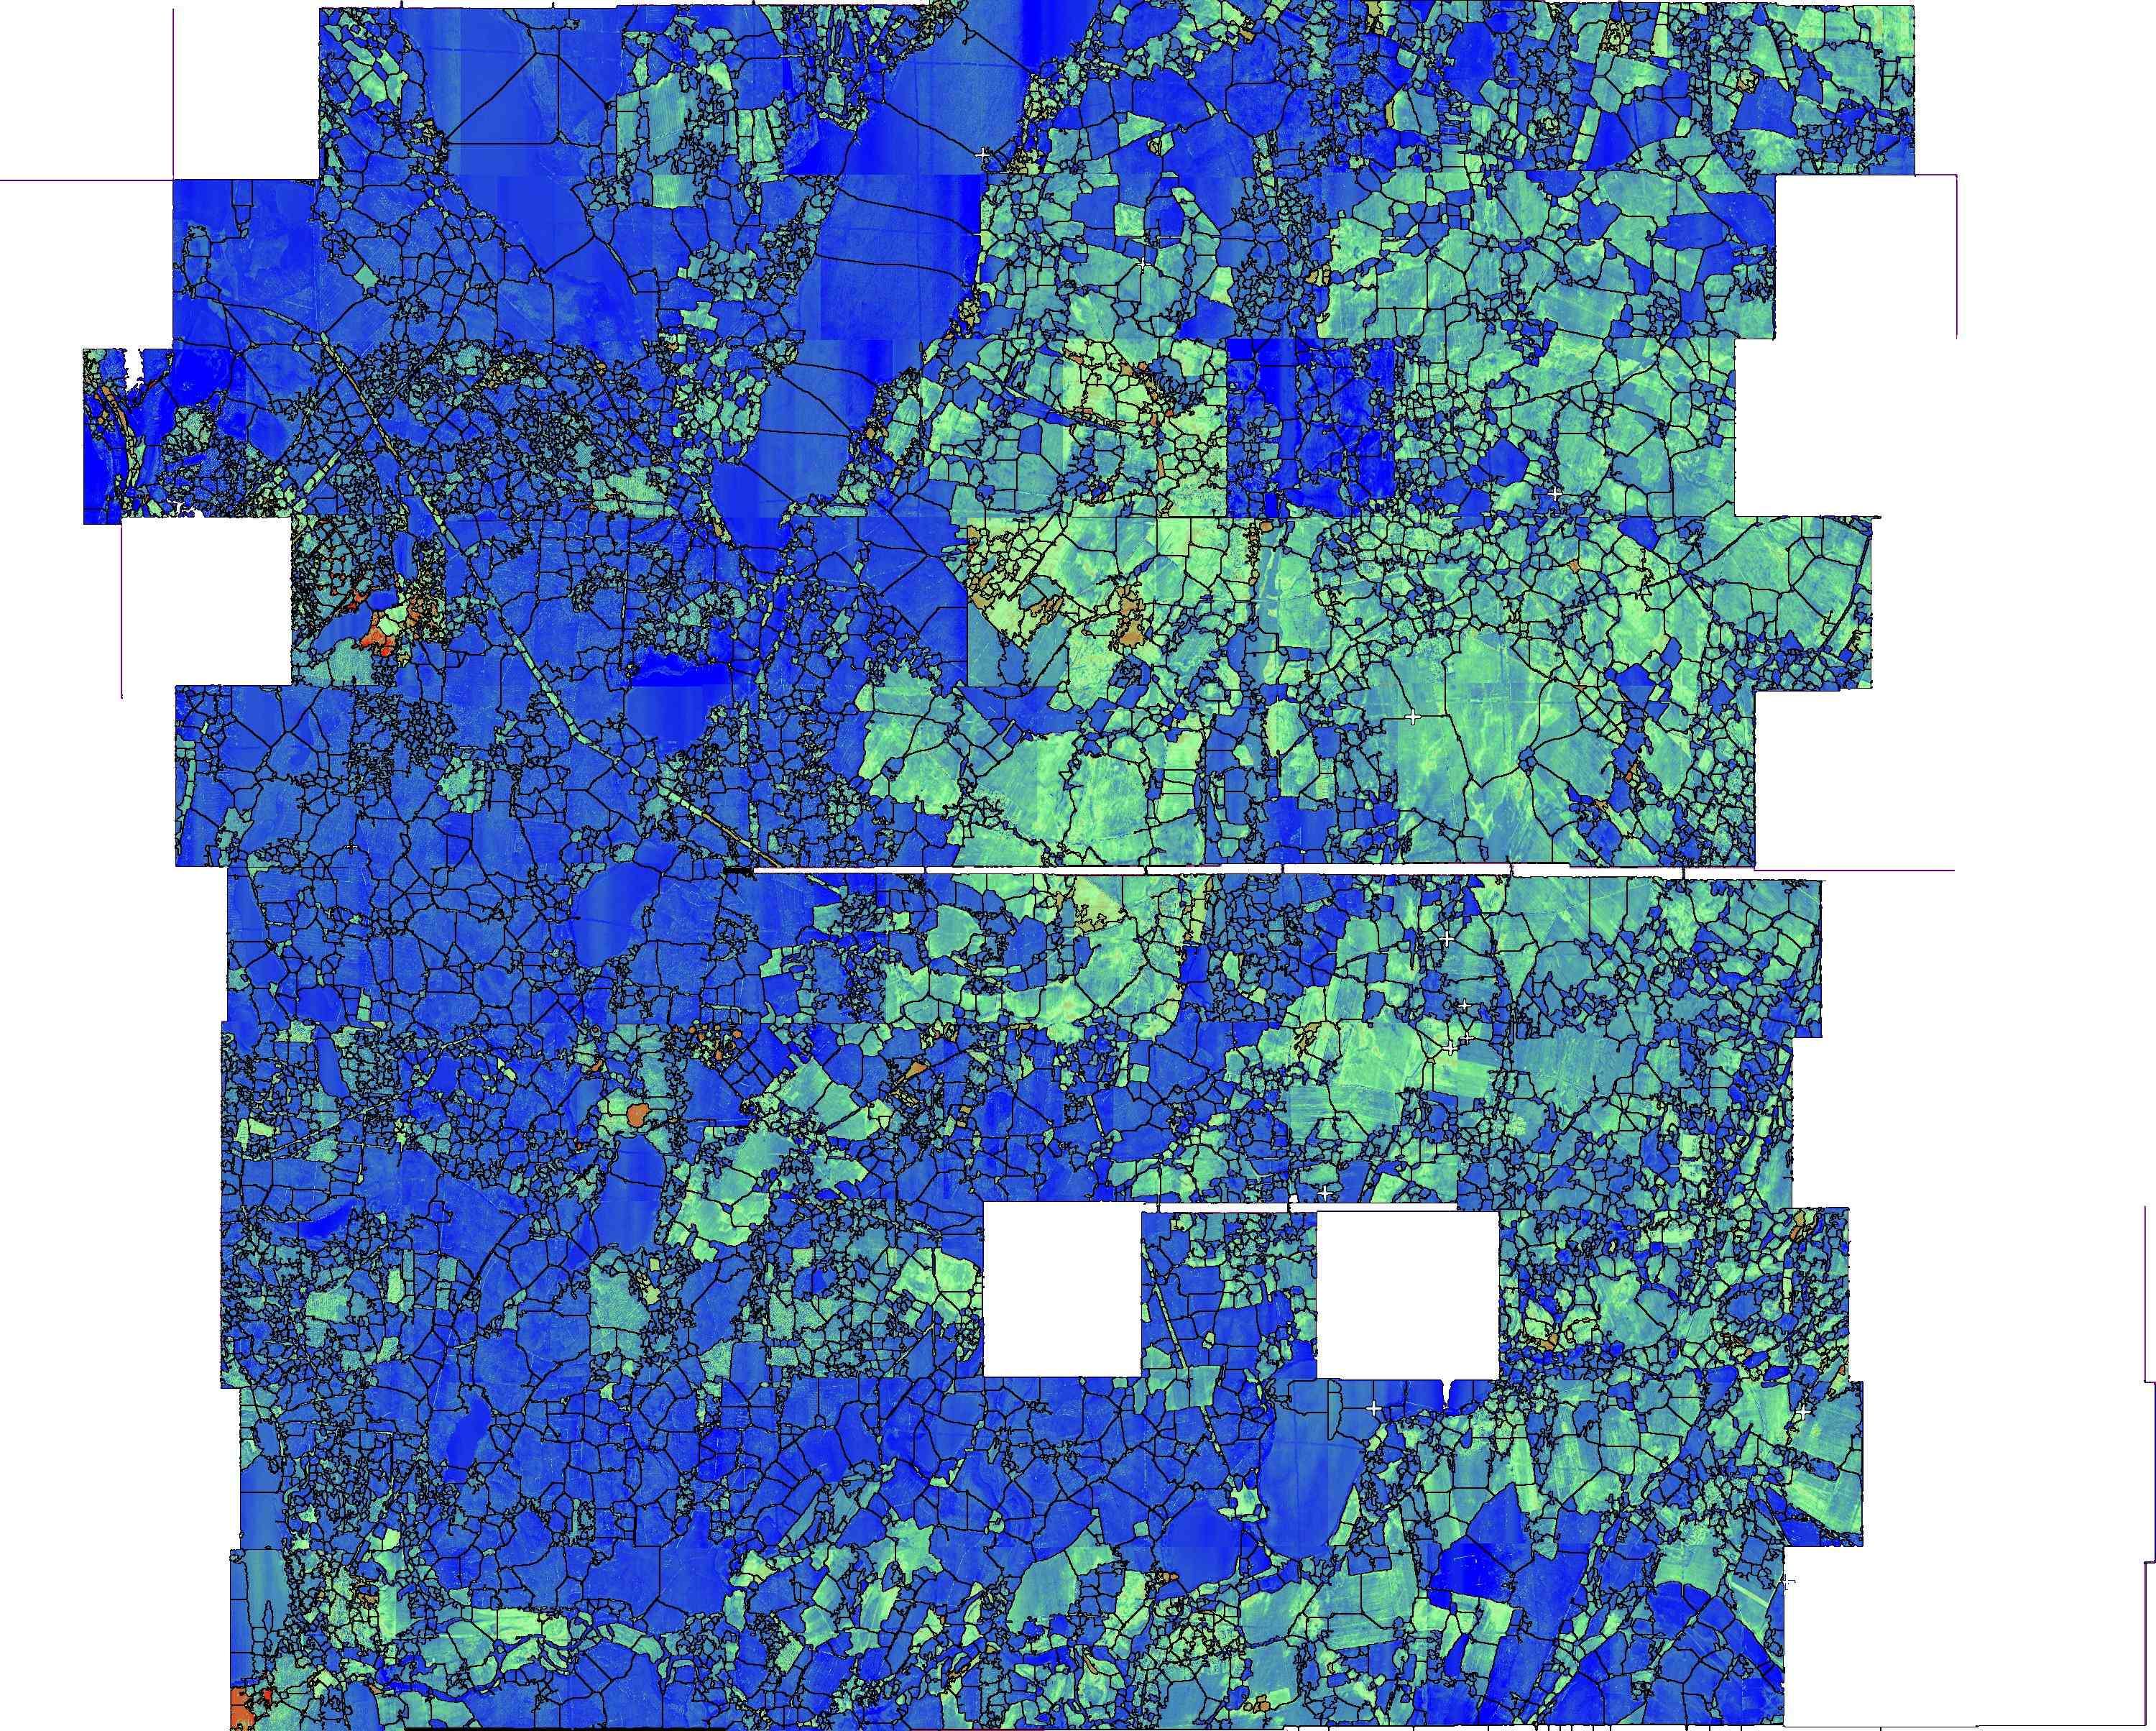
I´ve spend some time with imagej in the last weeks because i have a difficult task to solve. Now that i have some results, i´m not that happy with i would like to know if someone knows a better solution.  This is the source temperature map. Aim is to segment connected areas with the same/similar temperature to define the average size. Actual temperature of a "cell" is not of concern. This is my solution:  edit:(I despeckled the image) I selected red green and blue areas via color thresholding separately and used watersheding to receive the outlines which i copied over the actual image in photoshop. The average area is 182 pixels which "should" be rather something like 120 pixels. The lake in the top middle-left is segmented though i don´t know why and some other areas too. I would be very happy if someone knows a plugin like watershed which produces better results! Thank you, Jonathan |
Re: Help concerning Temperature Map
|
I'm curious, does an actual original temperture map exist or onlyu the
psuedo colored image. David Webster On Fri, May 6, 2011 at 9:45 AM, jgodeke <[hidden email]> wrote: > Hello! > > I´ve spend some time with imagej in the last weeks because i have a > difficult task to solve. > > Now that i have some results, i´m not that happy with i would like to know > if someone knows a better solution. > http://imagej.588099.n2.nabble.com/file/n6338176/temp.jpg > This is the source temperature map. Aim is to segment connected areas with > the same/similar temperature to define the average size. Actual temperature > of a "cell" is not of concern. > This is my solution: > http://imagej.588099.n2.nabble.com/file/n6338176/rotegrueneblaue.jpg > I selected red green and blue areas via color thresholding separately and > used watersheding to receive the outlines which i copied over the actual > image in photoshop. The average area is 182 pixels which "should" be rather > something like 120 pixels. The lake in the top middle-left is segmented > though i don´t know why and some other areas too. > > I would be very happy if someone knows a plugin like watershed which > produces better results! > > Thank you, > > Jonathan > > > -- > View this message in context: > http://imagej.588099.n2.nabble.com/Help-concerning-Temperature-Map-tp6338176p6338176.html > Sent from the ImageJ mailing list archive at Nabble.com. > |
|
If an actual temperature map would be greyscale then it exists. Somehow i never considered working with it.
|
Re: Help concerning Temperature Map
|
Well, now that I thin about it, segmenting the psuedo color map may easier
given ImageJ's available tools. I amn curious how you computed the aevrages Did you extract the areas for each cell, and then compute their mean value. I so were you able to look for outlier regions with areas >> 120, Can you your cpompue the region median in addition to mean? David Webster On Fri, May 6, 2011 at 11:11 AM, jgodeke <[hidden email]> wrote: > If an actual temperature map would be greyscale then it exists. Somehow i > never considered working with it. > > -- > View this message in context: > http://imagej.588099.n2.nabble.com/Help-concerning-Temperature-Map-tp6338176p6338428.html > Sent from the ImageJ mailing list archive at Nabble.com. > |
«
Return to ImageJ
|
1 view|%1 views
| Free forum by Nabble | Edit this page |

