Help with surface descriptors!
Help with surface descriptors!
|
Hi there,
first of all I am an amateur imageJ user. I need to come up with a variable (measurement) that can tell part the two attached images. These are yeast cells that have or don't have a high gray value close to the center of the cell.   I looked at the kurtosis but this is not enough as sometimes cells have high gray values on the edges and that results in an increased kurtosis value. The plot surface for the two types of cells (peak near the center OR no peak/peak on the edges of cell) enhances the differences between these two groups but I don't know how to get descriptive numbers out of the plots. Any help/comments? |
Re: Help with surface descriptors!
|
Giuseppe,
Have a look at this link on "How to count nuclear foci": http://microscopy.duke.edu/HOWTO/countfoci.html Try adding a small Gaussian blur, then see whether cells with single maxima vs. those with more than one will give the comparison you want. Or try the Nuclei Counter plug-in. Or try template matching using your small images as templates. It is hard to form an answer when your example images show only a single cell in each. Good luck. -----Original Message----- From: ImageJ Interest Group [mailto:[hidden email]] On Behalf Of giuseppe3 Sent: Thursday, August 28, 2014 12:17 AM To: [hidden email] Subject: Help with surface descriptors! Hi there, first of all I am an amateur imageJ user. I need to come up with a variable (measurement) that can tell part the two attached images. These are yeast cells that have or don't have a high gray value close to the center of the cell. <http://imagej.1557.x6.nabble.com/file/n5009390/peaked_cell.jpg> <http://imagej.1557.x6.nabble.com/file/n5009390/flat_cell.jpg> I looked at the kurtosis but this is not enough as sometimes cells have high gray values on the edges and that results in an increased kurtosis value. The plot surface for the two types of cells (peak near the center OR no peak/peak on the edges of cell) enhances the differences between these two groups but I don't know how to get descriptive numbers out of the plots. Any help/comments? -- View this message in context: http://imagej.1557.x6.nabble.com/Help-with-surface-descriptors-tp5009390.html Sent from the ImageJ mailing list archive at Nabble.com. -- ImageJ mailing list: http://imagej.nih.gov/ij/list.html -- ImageJ mailing list: http://imagej.nih.gov/ij/list.html |
Re: Help with surface descriptors!
|
Hi Charles,
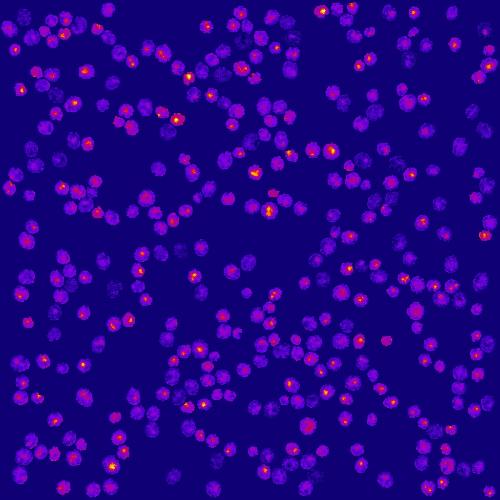
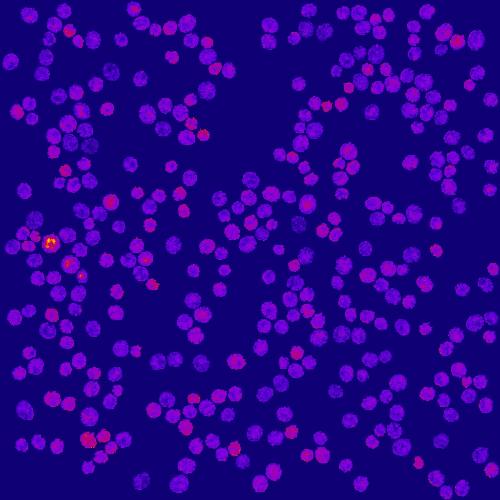
Thank you so much for your reply. Yes you are right my images were shocking! Here are full size fields of view from my microscope. Cells with a relatively central peak:  Cells with irregular/edge peaks or flat:  The LUT is fire and the yellow/red areas represent vacuoles when they are relatively central and stand out from the rest of the cell. I have ROIs for every cells in each image and I need to make another ROI for that peaked region given that it has the following criteria: 1. needs to have a minimum intensity of 3 (this is arbitrary for now but I am planning to fix this); 2. The maximum of this peaked region cannot be on the edge of the cell; 3. The peaked region must have a clear "valley" that separates it from the rest of the cell. 4. I need to make a selection of this peaked area and add it as an ROI for downstream measurements (I do this at the moment by finding the peak in the cell and then using the wand tool to grow an area) I hope this is clear and sorry for wasting your time. Thanks a lot. Giuseppe
|
«
Return to ImageJ
|
1 view|%1 views
| Free forum by Nabble | Edit this page |

