Red-yellow-green measurement on fluorescent images

Previous Topic Next Topic
 
classic Classic list List threaded Threaded
2 messages Options
Reply | Threaded
Open this post in threaded view
|

Red-yellow-green measurement on fluorescent images

Simon-Stott
Hi,
I would like to know if it is possible to set up a colour spectrum measurement for an image so that red=1 yellow=0 and green=-1, thus allowing us to use the point tool in imagej/fiji to measure the level of co-expression between cell somas on a fluorescent image such as the one attached.
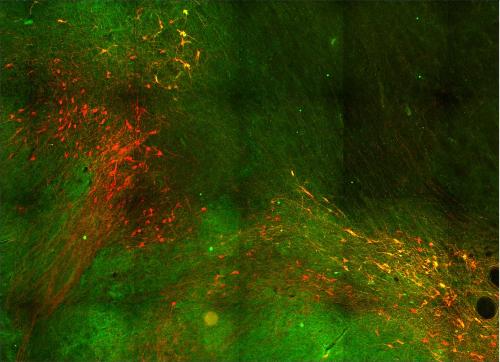

(Image is Tyrosine hydroxylase (dopamine neurons) in the red channel and calbindin (calcium binding protein) in the green channel on a coronal section of primate midbrain.

We are trying to identify subsets of midbrain dopamine neurons, and would like to offer a semi-quantitative measure indicating levels of expression in each subpopulation of cells. Any help would be greatly appreciated.
Simon
Reply | Threaded
Open this post in threaded view
|

Re: Red-yellow-green measurement on fluorescent images

Simon-Stott
I should add that our images are not confocal. The sections of primate midbrain are huge and we have approximately 20 of them across the A-P axis of the midbrain (series of 10; 35um thick). To cover all of the area of the dopamine neurons we are using the automated Olympus bx61 platform (x20 len with 0.35 micron per pixel resolution). Confocal microscopy together with JaCoP would take literally forever to do across all of the sections. The automated scanning approach has sped things up, but determining a semi-quantitative measure of colocalization is proving difficult, especially with some of the calcium binding proteins which have varying levels of expression between cells.