Hi,
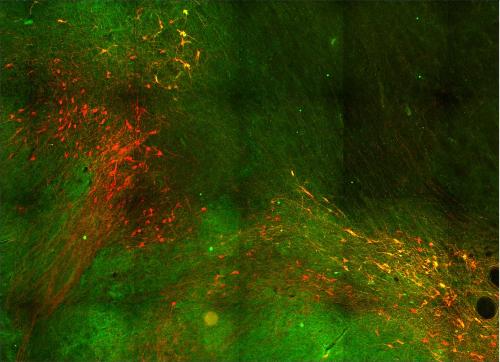
I would like to know if it is possible to set up a colour spectrum measurement for an image so that red=1 yellow=0 and green=-1, thus allowing us to use the point tool in imagej/fiji to measure the level of co-expression between cell somas on a fluorescent image such as the one attached.

(Image is Tyrosine hydroxylase (dopamine neurons) in the red channel and calbindin (calcium binding protein) in the green channel on a coronal section of primate midbrain.
We are trying to identify subsets of midbrain dopamine neurons, and would like to offer a semi-quantitative measure indicating levels of expression in each subpopulation of cells. Any help would be greatly appreciated.
Simon