Re: declump those buggers
Posted by Matthias Kirsch on Mar 23, 2011; 7:04pm
URL: http://imagej.273.s1.nabble.com/declump-those-buggers-tp3685220p3685222.html
Dear all,
thanks a lot for all your suggestions and comments. I will work with them as soon as possible (at the moment I am packed with teaching and examination duties).
I am happy to see that my post has not only stimulated some 'image analysis' discussions, but also some very basic scientifc ones. Now, to prevent misunderstandings: I do not only want to count cells. There are much easier ways to do this, even with ImageJ (I would just determine the area covered by DAPI-stained 'things' and divide that by an average nucleus area). I will attach cropped images of what I would eventually like to get at. For all the subsequent analysis steps it is mandatory to faithfully segment indivdual cells. It may even be necessary to determine the degree of clumping, as this also carries biological information.
We are working with cultures of neural stem cells, which, unfortunately are somewhat heterogeneous. We fix and stain them with various antibodies after whatever treatment. The question now is: what percentage of cells shows what level of staining for a particular marker? For a start I wanted to use nuclear stains, e.g. antibodies against transcriptions factors. Some cells will have a lot, others less. E.g. it will be interesting to determine which and how many of the proliferating cells, identified by an antibody against a proliferation marker, express transcription factor x. Combining various antibodies will then help to characterize the cells with respect to treatment. Think of it like a FACS-experiment, the difference being that the cells are not in suspension (this by the way could be achieved, but would require the cells to be dissociated, which not always is a good way to go about). So for each cell in the image there should be a 'number' for its staining intensity for 'label1', 'label2', and possibly more (depending on the number of labels one can apply). The basis for all this is to faithfully identify and segment all (or most) cells in the picture. Behind all of this obviously is an attempt to do this somewhat objectively, not making it necessary to put cohorts of students at work to count all of this manually, or better put 'eye'ly. Of course it will be necessary to analyze a lot of images in batch mode, ideally unsupervised (some moderate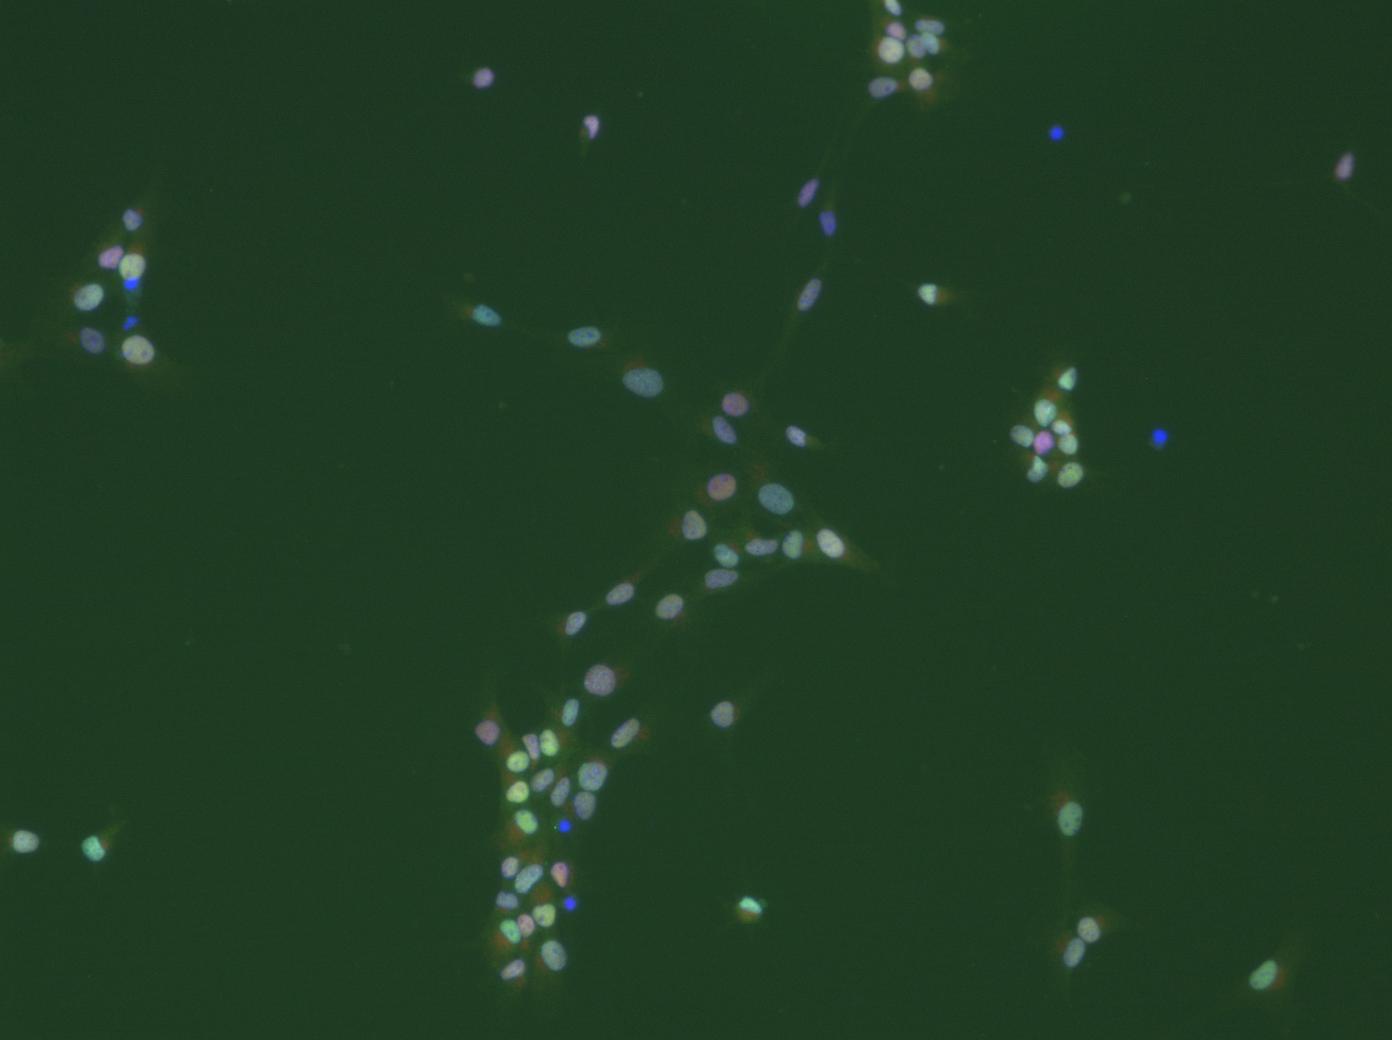 editing could be bearable at the end). If one would do a biochemical expriment, one would homogenize the cells, make a Western-Blot, normalize it to the number of cells and so on. In this way, however, information about single cells in a heterogeneous population would be lost all together.
In a next step of the analysis, we would like to include cytoplasmic markers as well, which then will make the whole business of doing all this on a single cell level even more demanding. But that's the direction, where a lot of commercial (and unaffordable) attempts are aimed at (see e.g. the Definiens software).
A useful addition in this context would be an interactive way of combining graphs of combinations of measurement with the images themselves: e.g. display a scatter blot of size vs. intensity and be able to click on a point in the graph and see the corresponding cell in the image and vice versa. In addition, doing somewhat like gating in FACS would be more than helpful.
All these wishes by far exceed my cababilities of constructing routines for ImageJ, which is why I am asking advice rom the vast community of 'cracks'.
This much for today. I will be happy to answer more questions and will certainly wellcome any suggestions. I will attach a picture with altogether three labels (dapi in the blue channel). Quality is limited as I can only uoload jpegs.
Cheers
Matthias
-
URL: http://imagej.273.s1.nabble.com/declump-those-buggers-tp3685220p3685222.html
Dear all,
thanks a lot for all your suggestions and comments. I will work with them as soon as possible (at the moment I am packed with teaching and examination duties).
I am happy to see that my post has not only stimulated some 'image analysis' discussions, but also some very basic scientifc ones. Now, to prevent misunderstandings: I do not only want to count cells. There are much easier ways to do this, even with ImageJ (I would just determine the area covered by DAPI-stained 'things' and divide that by an average nucleus area). I will attach cropped images of what I would eventually like to get at. For all the subsequent analysis steps it is mandatory to faithfully segment indivdual cells. It may even be necessary to determine the degree of clumping, as this also carries biological information.
We are working with cultures of neural stem cells, which, unfortunately are somewhat heterogeneous. We fix and stain them with various antibodies after whatever treatment. The question now is: what percentage of cells shows what level of staining for a particular marker? For a start I wanted to use nuclear stains, e.g. antibodies against transcriptions factors. Some cells will have a lot, others less. E.g. it will be interesting to determine which and how many of the proliferating cells, identified by an antibody against a proliferation marker, express transcription factor x. Combining various antibodies will then help to characterize the cells with respect to treatment. Think of it like a FACS-experiment, the difference being that the cells are not in suspension (this by the way could be achieved, but would require the cells to be dissociated, which not always is a good way to go about). So for each cell in the image there should be a 'number' for its staining intensity for 'label1', 'label2', and possibly more (depending on the number of labels one can apply). The basis for all this is to faithfully identify and segment all (or most) cells in the picture. Behind all of this obviously is an attempt to do this somewhat objectively, not making it necessary to put cohorts of students at work to count all of this manually, or better put 'eye'ly. Of course it will be necessary to analyze a lot of images in batch mode, ideally unsupervised (some moderate
editing could be bearable at the end). If one would do a biochemical expriment, one would homogenize the cells, make a Western-Blot, normalize it to the number of cells and so on. In this way, however, information about single cells in a heterogeneous population would be lost all together.
In a next step of the analysis, we would like to include cytoplasmic markers as well, which then will make the whole business of doing all this on a single cell level even more demanding. But that's the direction, where a lot of commercial (and unaffordable) attempts are aimed at (see e.g. the Definiens software).
A useful addition in this context would be an interactive way of combining graphs of combinations of measurement with the images themselves: e.g. display a scatter blot of size vs. intensity and be able to click on a point in the graph and see the corresponding cell in the image and vice versa. In addition, doing somewhat like gating in FACS would be more than helpful.
All these wishes by far exceed my cababilities of constructing routines for ImageJ, which is why I am asking advice rom the vast community of 'cracks'.
This much for today. I will be happy to answer more questions and will certainly wellcome any suggestions. I will attach a picture with altogether three labels (dapi in the blue channel). Quality is limited as I can only uoload jpegs.
Cheers
Matthias
-
| Free forum by Nabble | Disable Popup Ads | Edit this page |