RE: Modify (or create) results table
Posted by Cyril Turiès on Oct 22, 2015; 9:09am
URL: http://imagej.273.s1.nabble.com/Modify-or-create-results-table-tp5011481p5014718.html
Hi,
I tried a new version to edit the ImageJ Result table at the end of the macro.
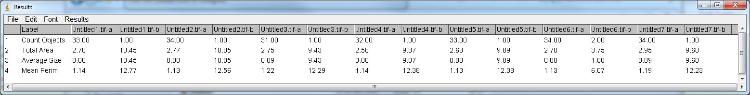
During the batch process results are added to arrays and after the last image the result table is updated with all measurements:
I did not test the macro on a directory containing sub-directories so be careful in that case.
You have to paste the code from CustomTabStatFromResults below the "tab functions" line, I didn't copied it because it was unchanged.
Just let me know if it works with your image analysis.
Cyril
________________________________________
// tab variables
var windowTabName="Stat Results Table",nameOfStatTab="["+windowTabName+"]",label="",undoErease="";
// stat variables
var nbPerim=0,TheTotalArea=0,meanPerim=0,meanObject=0;
dir1 = getDirectory("Choose Source Directory ");
list = getFileList(dir1);
setBatchMode(true);
for (i=0; i<list.length; i++) {
showProgress(i, list.length);
open(dir1+list[i]);
run("Min...", "value=140");
run("8-bit");
// Changed to AutoThreshold// run("Auto Local Threshold", "method=Median radius=15 parameter_1=0 parameter_2=0 white");
setAutoThreshold("Mean");
setOption("BlackBackground", false);
run("Set Scale...", "distance=1617 known=21.8 pixel=1 unit=cm");
run("Set Measurements...", "area perimeter shape feret's display redirect=None decimal=2");
run("Analyze Particles...", "size=0.05-Infinity circularity=0.2-1.00 show=[Overlay Outlines] display clear include record in_situ");
if (nResults() > 0 && isOpen("Results")) {
makeStatFromResults ();
TabWindow (1);
} else { print(nameOfStatTab, label+"-No result");}
// Arrays containing results of first particle analysis
if (i == 0){
resLabel = newArray(""+label+"-a");
resNB = newArray(1);
Array.fill(resNB, nResults());
resArea = newArray(1);
Array.fill(resArea, TheTotalArea);
resObject = newArray(1);
Array.fill(resObject, d2s(meanObject,2));
resPerim = newArray(1);
Array.fill(resPerim, d2s(meanPerim,2));
} else {
resLabel = Array.concat(resLabel, label+"-a");
resNB = Array.concat(resNB, nResults());
resArea = Array.concat(resArea, TheTotalArea);
resObject = Array.concat(resObject, d2s(meanObject,2));
resPerim = Array.concat(resPerim, d2s(meanPerim,2));
}
run("Gaussian Blur...", "sigma=50");
run("Make Binary");
run("Analyze Particles...", "size=0.05-Infinity circularity=0.20-1.00 show=[Overlay Outlines] display clear include record in_situ");
if (nResults() > 0 && isOpen("Results")) {
makeStatFromResults ();
TabWindow (1);
} else { print(nameOfStatTab, label+"-No result");}
// Add results from second analysis to arrays
resLabel = Array.concat(resLabel, label+"-b");
resNB = Array.concat(resNB, nResults());
resArea = Array.concat(resArea, TheTotalArea);
resObject = Array.concat(resObject, d2s(meanObject,2));
resPerim = Array.concat(resPerim, d2s(meanPerim,2));
}
// Add results from arrays to results table
run("Clear Results");
run("Set Measurements...", " redirect=None decimal=2");
updateResults();
setResult("Label", 0, "Count Objects");
setResult("Label", 1, "Total Area");
setResult("Label", 2, "Average Size");
setResult("Label", 3, "Mean Perim");
updateResults();
for (a=0; a<resLabel.length; a++) {
setResult(resLabel[a], 0, resNB[a]);
setResult(resLabel[a], 1, resArea[a]);
setResult(resLabel[a], 2, resObject[a]);
setResult(resLabel[a], 3, resPerim[a]);
updateResults();
}
// --------------- tab functions ---------------//
//CustomTabStatFromResults
// Author : Gilles Carpentier
// Faculte des Sciences et Technologies,
// Universite Paris 12 Val de Marne, France.
..... insert here CustomTabStatFromResults functions
URL: http://imagej.273.s1.nabble.com/Modify-or-create-results-table-tp5011481p5014718.html
Hi,
I tried a new version to edit the ImageJ Result table at the end of the macro.
During the batch process results are added to arrays and after the last image the result table is updated with all measurements:
I did not test the macro on a directory containing sub-directories so be careful in that case.
You have to paste the code from CustomTabStatFromResults below the "tab functions" line, I didn't copied it because it was unchanged.
Just let me know if it works with your image analysis.
Cyril
________________________________________
// tab variables
var windowTabName="Stat Results Table",nameOfStatTab="["+windowTabName+"]",label="",undoErease="";
// stat variables
var nbPerim=0,TheTotalArea=0,meanPerim=0,meanObject=0;
dir1 = getDirectory("Choose Source Directory ");
list = getFileList(dir1);
setBatchMode(true);
for (i=0; i<list.length; i++) {
showProgress(i, list.length);
open(dir1+list[i]);
run("Min...", "value=140");
run("8-bit");
// Changed to AutoThreshold// run("Auto Local Threshold", "method=Median radius=15 parameter_1=0 parameter_2=0 white");
setAutoThreshold("Mean");
setOption("BlackBackground", false);
run("Set Scale...", "distance=1617 known=21.8 pixel=1 unit=cm");
run("Set Measurements...", "area perimeter shape feret's display redirect=None decimal=2");
run("Analyze Particles...", "size=0.05-Infinity circularity=0.2-1.00 show=[Overlay Outlines] display clear include record in_situ");
if (nResults() > 0 && isOpen("Results")) {
makeStatFromResults ();
TabWindow (1);
} else { print(nameOfStatTab, label+"-No result");}
// Arrays containing results of first particle analysis
if (i == 0){
resLabel = newArray(""+label+"-a");
resNB = newArray(1);
Array.fill(resNB, nResults());
resArea = newArray(1);
Array.fill(resArea, TheTotalArea);
resObject = newArray(1);
Array.fill(resObject, d2s(meanObject,2));
resPerim = newArray(1);
Array.fill(resPerim, d2s(meanPerim,2));
} else {
resLabel = Array.concat(resLabel, label+"-a");
resNB = Array.concat(resNB, nResults());
resArea = Array.concat(resArea, TheTotalArea);
resObject = Array.concat(resObject, d2s(meanObject,2));
resPerim = Array.concat(resPerim, d2s(meanPerim,2));
}
run("Gaussian Blur...", "sigma=50");
run("Make Binary");
run("Analyze Particles...", "size=0.05-Infinity circularity=0.20-1.00 show=[Overlay Outlines] display clear include record in_situ");
if (nResults() > 0 && isOpen("Results")) {
makeStatFromResults ();
TabWindow (1);
} else { print(nameOfStatTab, label+"-No result");}
// Add results from second analysis to arrays
resLabel = Array.concat(resLabel, label+"-b");
resNB = Array.concat(resNB, nResults());
resArea = Array.concat(resArea, TheTotalArea);
resObject = Array.concat(resObject, d2s(meanObject,2));
resPerim = Array.concat(resPerim, d2s(meanPerim,2));
}
// Add results from arrays to results table
run("Clear Results");
run("Set Measurements...", " redirect=None decimal=2");
updateResults();
setResult("Label", 0, "Count Objects");
setResult("Label", 1, "Total Area");
setResult("Label", 2, "Average Size");
setResult("Label", 3, "Mean Perim");
updateResults();
for (a=0; a<resLabel.length; a++) {
setResult(resLabel[a], 0, resNB[a]);
setResult(resLabel[a], 1, resArea[a]);
setResult(resLabel[a], 2, resObject[a]);
setResult(resLabel[a], 3, resPerim[a]);
updateResults();
}
// --------------- tab functions ---------------//
//CustomTabStatFromResults
// Author : Gilles Carpentier
// Faculte des Sciences et Technologies,
// Universite Paris 12 Val de Marne, France.
..... insert here CustomTabStatFromResults functions
| Free forum by Nabble | Disable Popup Ads | Edit this page |