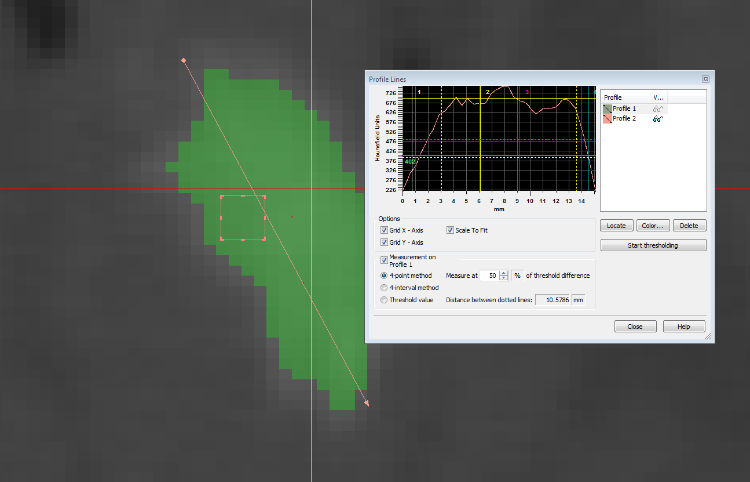
I'm currently working on a project to noninvasively map/track contrast injectate for use in local pharmacokinetics/pharmacodynamics analysis. In essence, we need to know how the attenuation (Hu) values are changing within a injectate mass in any given orientation (in order to correlate contrast changes with tissue composition). Does ImageJ offer the ability to not only view a series of points and their attenuation values along a line drawn on a image as a histogram (profile line), but to view the attenuation values of each individual point/pixel on the line in something resembling a excel sheet? I've attached an image from another image analysis program, Mimics, which to my knowledge does not offer the ability currently as a reference.
