Filter problem


|
Dear all,
I`m using image j for analyzing my fluorescence images. But I have a problem with my microscope. When I looked with green channel at fluorescence microscope, I see green and red signals on my images. I know it is a filter problem. But I must overcome this problem without changing filter. How can I correct these images with image j? Thanks. Gizem Oyman Izmir Institute of Technology Biotechnology and Bioengineering Department |
|
|
Hi
I'm confused: How are you collecting the image? By Colour camera or Photomultiplier? How many fluorescent dyes do you have? You can do calibrations with different pure red/pure green fluorescent tracers through the filters but this is unlikely to be successful. If you are only have one dye then it does not matter at all anyway... You can split an images colours: image>colours>split channels and use colour you want but if you have collected the wrong wavelength it won't solve the problem. Kenton On 23 June 2012 21:26, gizem <[hidden email]> wrote: > Dear all, > > I`m using image j for analyzing my fluorescence images. But I have a > problem > with my microscope. When I looked with green channel at fluorescence > microscope, I see green and red signals on my images. I know it is a filter > problem. But I must overcome this problem without changing filter. How can > I > correct these images with image j? > > Thanks. > > Gizem Oyman > Izmir Institute of Technology > Biotechnology and Bioengineering Department > > -- > View this message in context: > http://imagej.1557.n6.nabble.com/Filter-problem-tp4999173.html > Sent from the ImageJ mailing list archive at Nabble.com. > > -- > ImageJ mailing list: http://imagej.nih.gov/ij/list.html > -- ImageJ mailing list: http://imagej.nih.gov/ij/list.html |
|
|
In reply to this post by gizem
I want to be delistfd from the group
thank you RAHEEM ________________________________ From: gizem <[hidden email]> To: [hidden email] Sent: Saturday, June 23, 2012 9:26 PM Subject: Filter problem Dear all, I`m using image j for analyzing my fluorescence images. But I have a problem with my microscope. When I looked with green channel at fluorescence microscope, I see green and red signals on my images. I know it is a filter problem. But I must overcome this problem without changing filter. How can I correct these images with image j? Thanks. Gizem Oyman Izmir Institute of Technology Biotechnology and Bioengineering Department -- View this message in context: http://imagej.1557.n6.nabble.com/Filter-problem-tp4999173.html Sent from the ImageJ mailing list archive at Nabble.com. -- ImageJ mailing list: http://imagej.nih.gov/ij/list.html -- ImageJ mailing list: http://imagej.nih.gov/ij/list.html |
|
|
Hi RAHEEM,
On Sat, 23 Jun 2012, ayo raheem wrote: > I want to be delistfd from the group http://imagej.nih.gov/ij/docs/faqs.html#list Hth, Johannes -- ImageJ mailing list: http://imagej.nih.gov/ij/list.html |
|
|
In reply to this post by Kenton Arkill
Hi Kenton,
I collect to the image with colour camera. I have four different colour camera and four different fluorescent filter in my fluorescence microscope. When I take image with green fluorescencent filter and split this images with split channels command, I see some signals at red channel also. So, I must correct to these images with image j. It is not realted with wavelenght, it is only related with filter of my fluorescencent microscope. |
|
|
Hi
Your camera CCDs has broad wavelength detection, so you would expect a low level of 'red' in your 'green'. If you are single tracing, i.e. there is only one dye you are looking at, then it does not matter, either just use the green channel (as it is more linear to the intensity) or all (make it greyscale) as it detects more. If you are dual tracing then you need to test the filters not the camera to see how much of the 'wrong' colour is actually getting though. In essence with filters you are using the camera as an intensity meter in the same way that other people collect greyscale, but you have extra (I think in your case irrelevant) channel information. This assumes you put the light on with a filter (e.g. mercury lamp and a 488 filter), and a return path blocking the 488 and letting though a band e.g. 530-550. If this last band is not there dual dye tracing is almost impossible, if single dye tracing then it is irrelevant. Another note be very careful with your gain and exposure settings, changing them wrecks your quantisation (if you want more than simple location) yet colour cameras have a dynamic range of only 0-255 in each channel. Kenton Kenton Arkill GB U23 Ladies' Underwater Hockey Coach On 24 Jun 2012, at 11:23, gizem wrote: > Hi Kenton, > > I collect to the image with colour camera. I have four different colour > camera and four different fluorescent filter in my fluorescence microscope. > When I take image with green fluorescencent filter and split this images > with split channels command, I see some signals at red channel also. So, I > must correct to these images with image j. It is not realted with > wavelenght, it is only related with filter of my fluorescencent microscope. > > -- > View this message in context: http://imagej.1557.n6.nabble.com/Filter-problem-tp4999173p4999178.html > Sent from the ImageJ mailing list archive at Nabble.com. > > -- > ImageJ mailing list: http://imagej.nih.gov/ij/list.html -- ImageJ mailing list: http://imagej.nih.gov/ij/list.html |
|
|
In reply to this post by gizem
Just to add to what Kenton wrote. I found that even when working with
Confocal there as very often bleed over from the green channel into the red channel. Also for UV excited fluorophores the blue will bleed into the green. It appears to be related to the energy level of the exciting wavelength. There is less bleed over from red to far red. Kenton solution is the best way to handle your situation. This bleed over is especially frustrating when you are dealing with a two dyes a green emitter and a red emitter. The only way is to collect them separately. Mike -----Original Message----- From: ImageJ Interest Group [mailto:[hidden email]] On Behalf Of gizem Sent: Sunday, June 24, 2012 6:24 AM To: [hidden email] Subject: Re: Filter problem Hi Kenton, I collect to the image with colour camera. I have four different colour camera and four different fluorescent filter in my fluorescence microscope. When I take image with green fluorescencent filter and split this images with split channels command, I see some signals at red channel also. So, I must correct to these images with image j. It is not realted with wavelenght, it is only related with filter of my fluorescencent microscope. -- View this message in context: http://imagej.1557.n6.nabble.com/Filter-problem-tp4999173p4999178.html Sent from the ImageJ mailing list archive at Nabble.com. -- ImageJ mailing list: http://imagej.nih.gov/ij/list.html -- ImageJ mailing list: http://imagej.nih.gov/ij/list.html |
|
|
Hi there. I did some searching to try to resolve the issue described
below but failed to find a reasonable answer. So, here is my problem. I have 4 fish in a tank. In one part of the tank are some plants giving them protection. The fish, per tank, are exposed to a chemical and I follow their reaction. Specifically, I measure how far do they get out of their hideout. The hypothesis is that depending on the chemical they will go further away form the hideout as compared to the control group. What I do MANUALLY right now is watch the video and measure on the screen the distance, make Excel sheet and do the statistics. Clearly this is the most inefficient way to go, especially since I have more than 1000h video. I looked at Multitracker and other plugins but none of them will do the job I described above. Ideally, what I would like is to have a "cloud" of the tracks with the hideout as the center. I could measure then the diameter of the "cloud" and compare. Can anyone point me in the right direction? Thank you!!! Przemko -- Przemko Tylzanowski PhD Dept. Development and Regeneration LSD& Joints ON1 box 813 University of Leuven Herestraat 49 3000 Leuven Belgium phone: +32-16-34-61-96 fax : +32-16-34-62-00 -- ImageJ mailing list: http://imagej.nih.gov/ij/list.html |
|
|
Dear Przemko,
Have a look at the Chemotaxis and Migration Tool Plugin developed by Ibidi (http://www.ibidi.com/products/sw_img_analysis/p_cm_tool.html). If I remember it well you can use tracking data from other imageJ plugins to create all kinds of graphs and plots. Best wishes Kees Dr Ir K.R. Straatman Senior Experimental Officer Centre for Core Biotechnology Services College of Medicine, Biological Sciences and Psychology University of Leicester 20-24 August Fluorescence microscopy workshops: http://www.le.ac.uk/biochem/microscopy/workshop2012.html -----Original Message----- From: ImageJ Interest Group [mailto:[hidden email]] On Behalf Of Przemko Sent: 25 June 2012 08:41 To: [hidden email] Subject: 3 D tracking problem of fish Hi there. I did some searching to try to resolve the issue described below but failed to find a reasonable answer. So, here is my problem. I have 4 fish in a tank. In one part of the tank are some plants giving them protection. The fish, per tank, are exposed to a chemical and I follow their reaction. Specifically, I measure how far do they get out of their hideout. The hypothesis is that depending on the chemical they will go further away form the hideout as compared to the control group. What I do MANUALLY right now is watch the video and measure on the screen the distance, make Excel sheet and do the statistics. Clearly this is the most inefficient way to go, especially since I have more than 1000h video. I looked at Multitracker and other plugins but none of them will do the job I described above. Ideally, what I would like is to have a "cloud" of the tracks with the hideout as the center. I could measure then the diameter of the "cloud" and compare. Can anyone point me in the right direction? Thank you!!! Przemko -- Przemko Tylzanowski PhD Dept. Development and Regeneration LSD& Joints ON1 box 813 University of Leuven Herestraat 49 3000 Leuven Belgium phone: +32-16-34-61-96 fax : +32-16-34-62-00 -- ImageJ mailing list: http://imagej.nih.gov/ij/list.html -- ImageJ mailing list: http://imagej.nih.gov/ij/list.html |
|
|
This post was updated on .
In reply to this post by Kenton Arkill
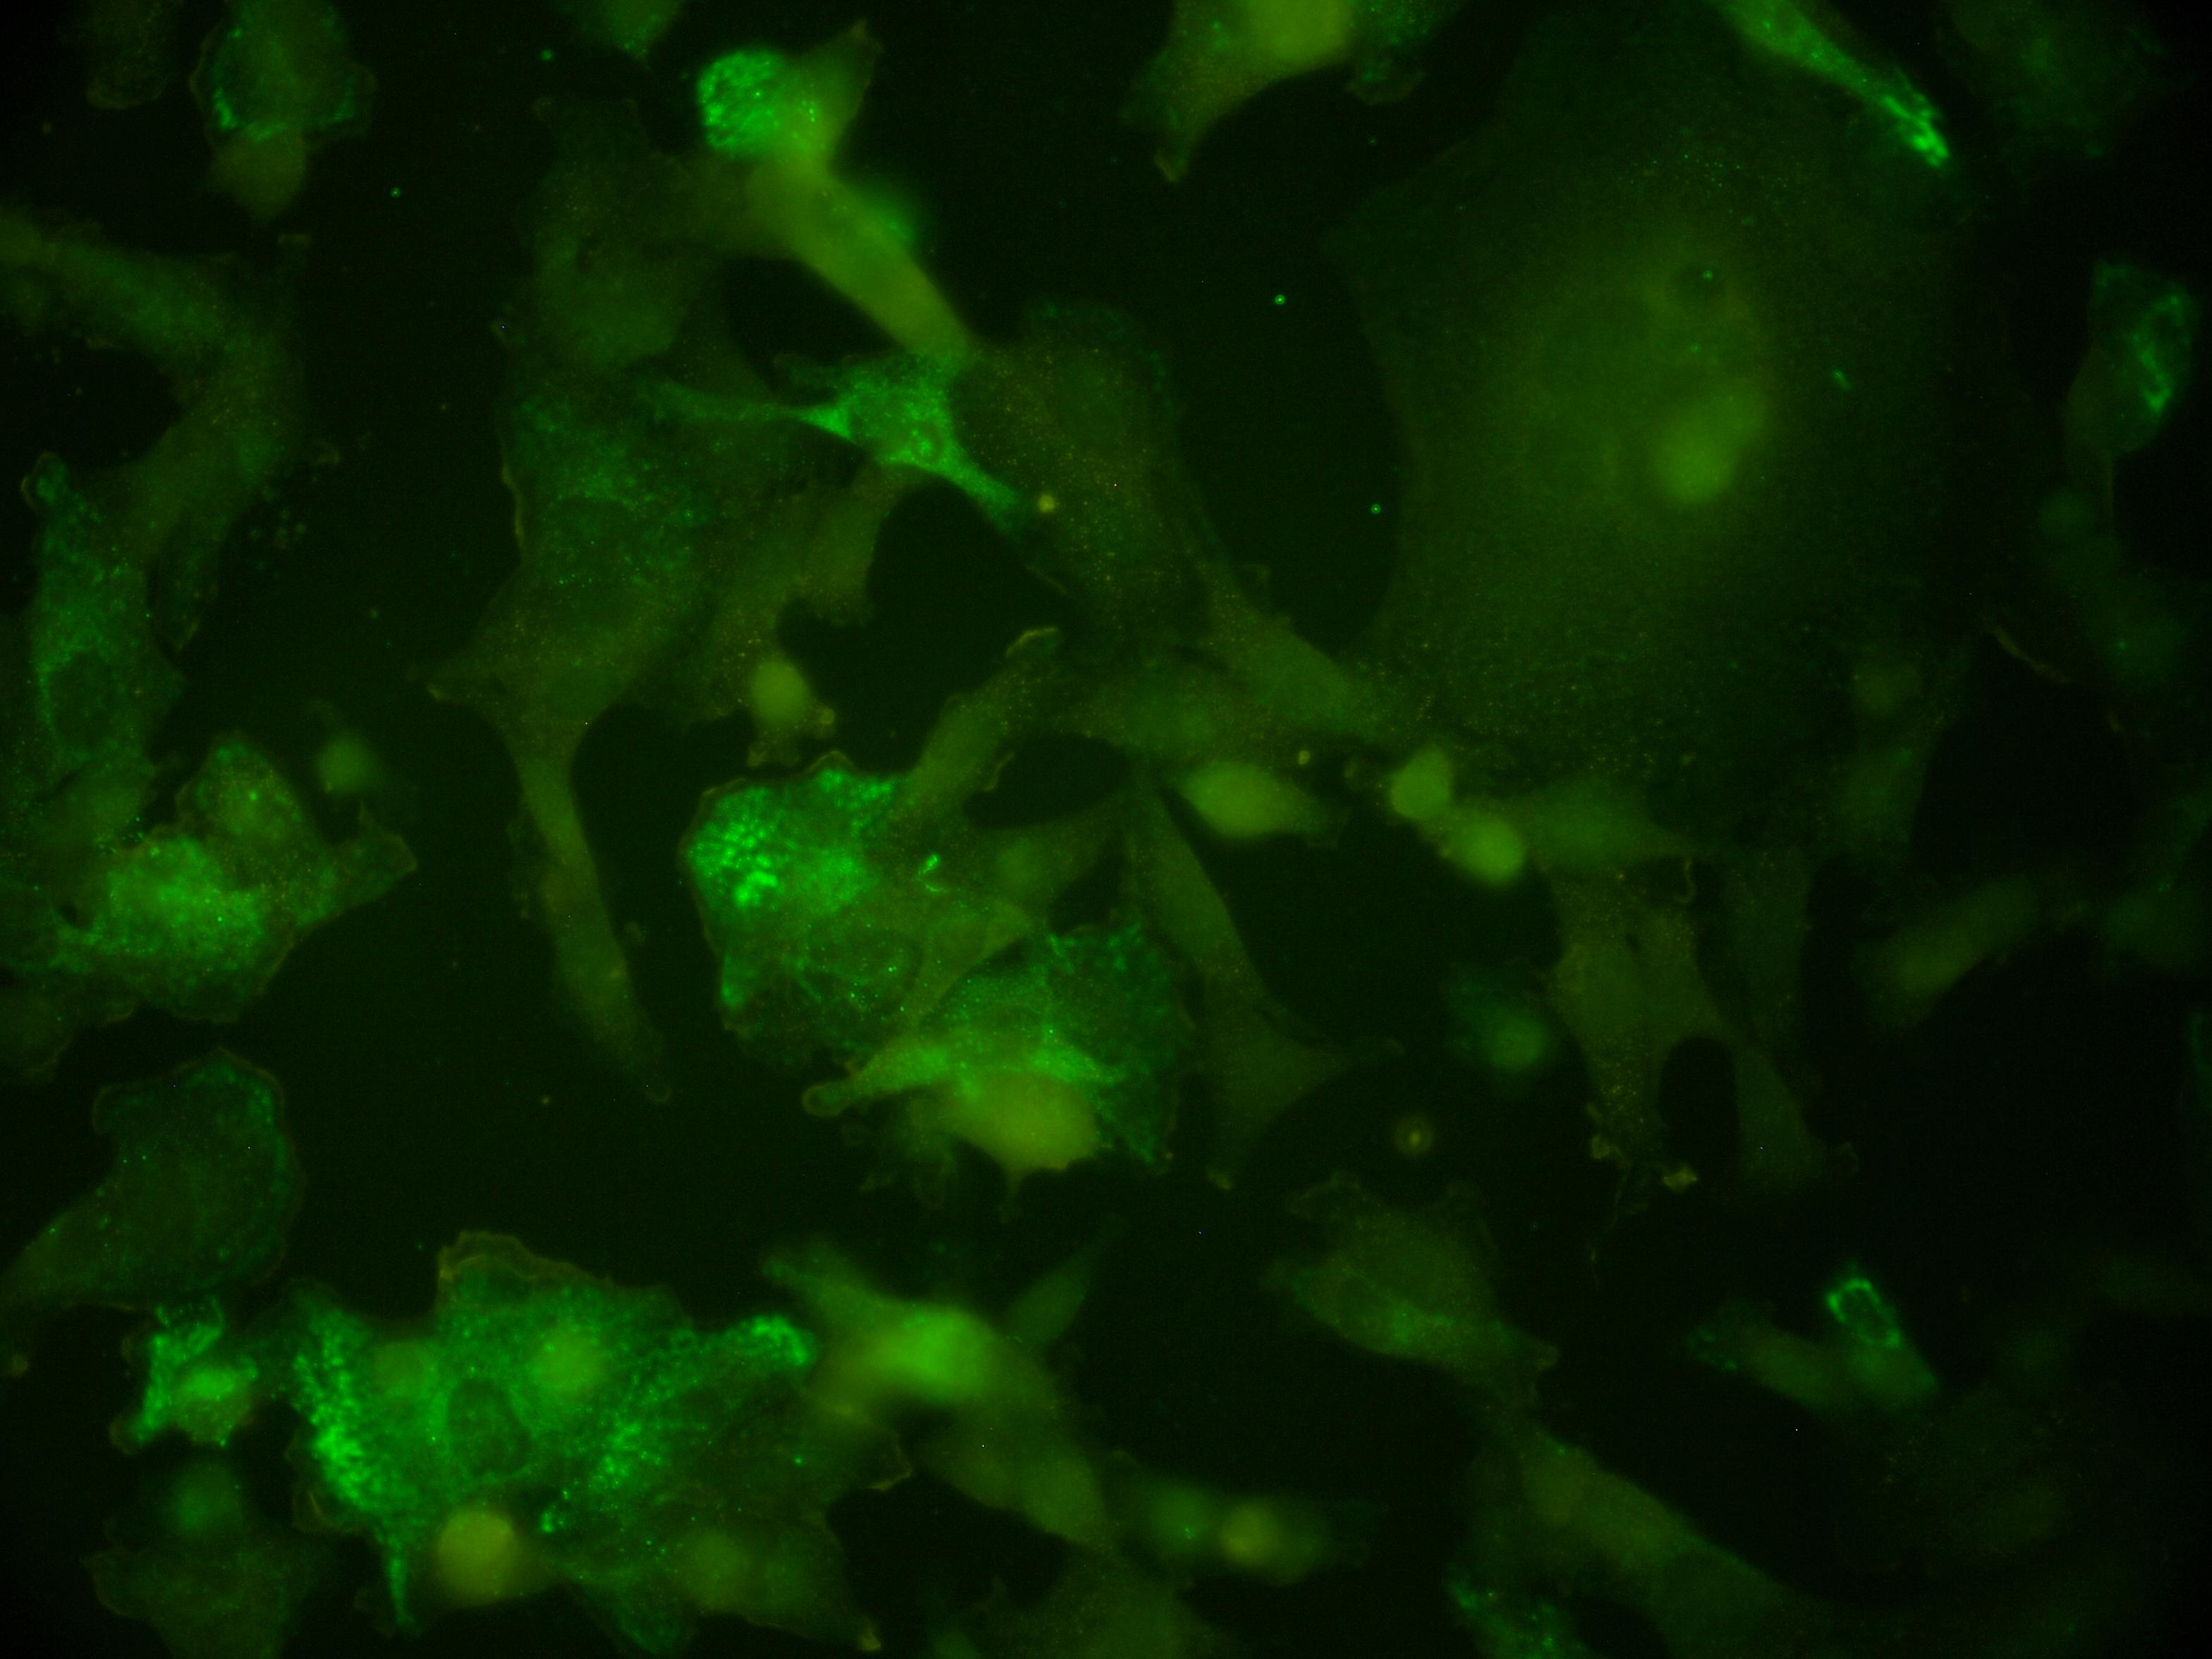 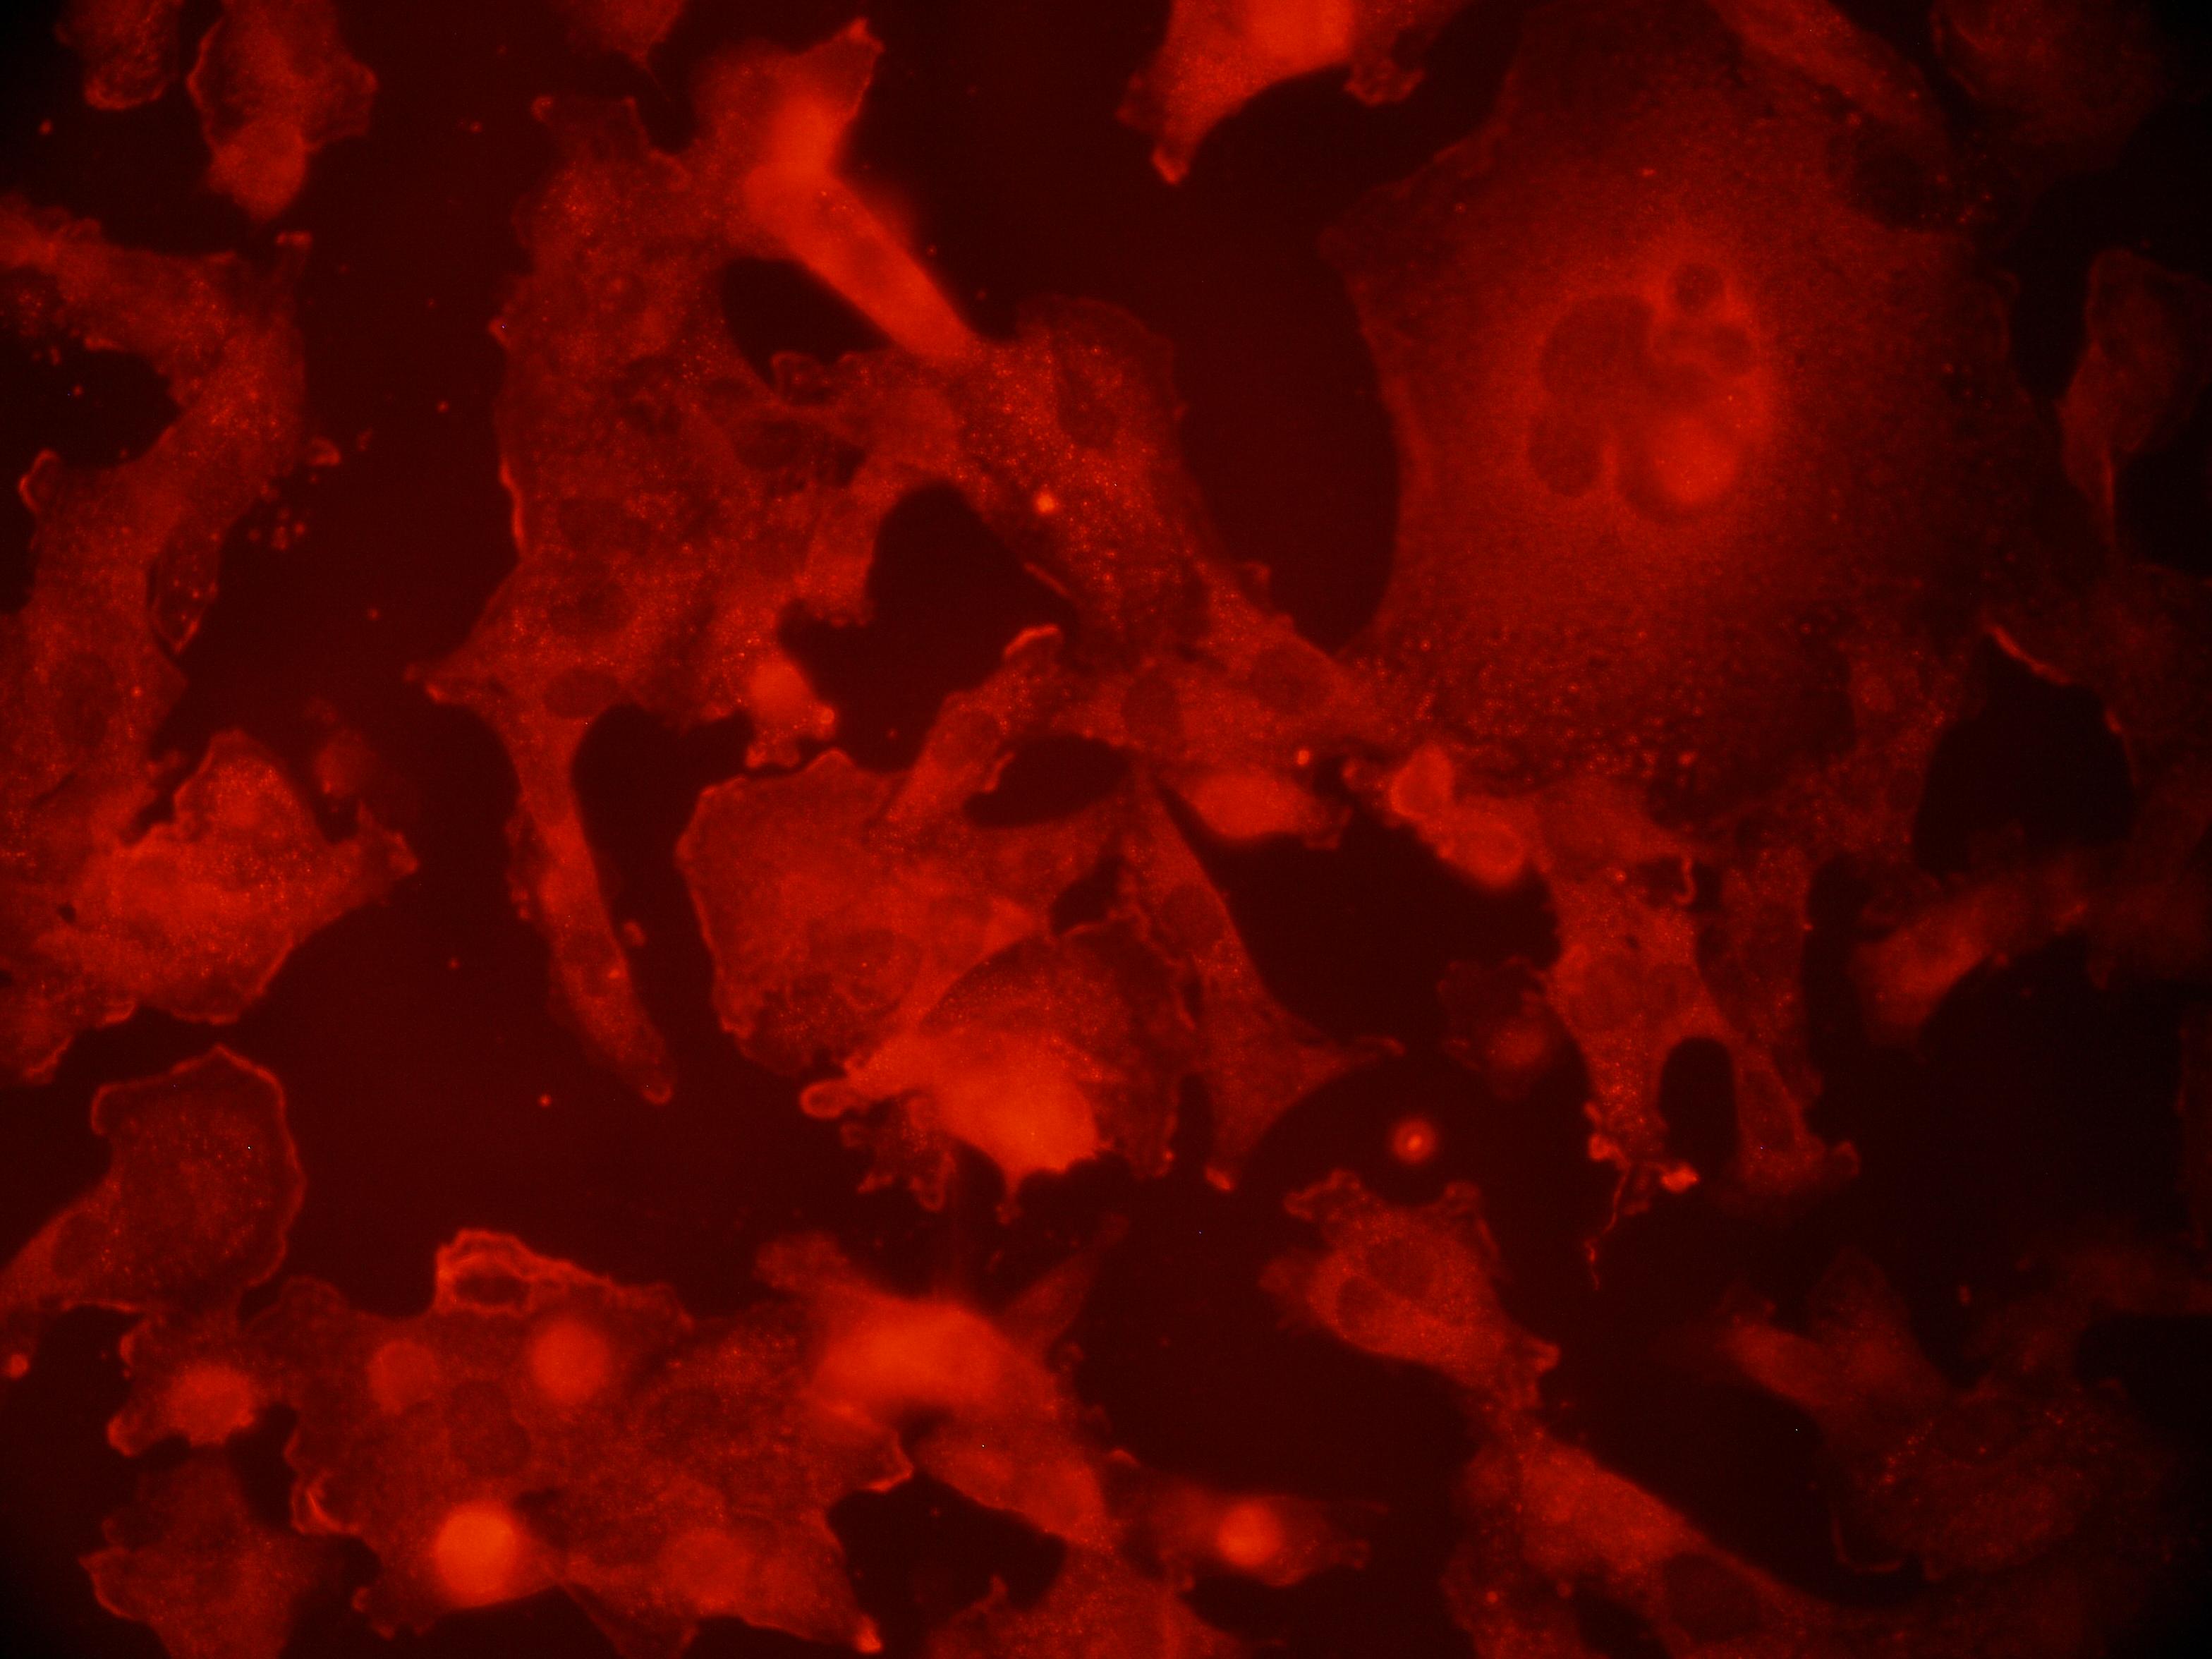 we have a color camera to capture images the sample is dual labeled green and red the filters collect green-red and red only channels tried to subtract red from green-red to get green only signal but that did not work well. Also I attached these images. any suggestions are welcome |
|
|
Hi
Assuming you are exciting your sample separately, you need to do this with separate dyes (not in sample) What you want: For green dye (e.g. FITC) Blue excitation excited and detected via green filter. For red dye (eg Rhodamine) Green excitation and red filter detection (e.g. rhodamine). Need to check For red dye Blue excitation excited and detected via green filter. For green dye Green excitation and red filter detection . If these are zero just use the brightest colour on the camera (the actual colours on the camera are a distraction). If one has bleed though then you can (if checked calibration) use the good one to work out the bleed through. If both bleed then hopeless even if possible! (because of background fluorescence in sample) I expect most of us on this list have at some stage had rows of capillary tubes with various concentration of dye to check this…(it also checks linearity of detection). also check around your expected mixed concentration as sometimes these are very different and you can lose the ability to quantify (green fluorescent absorbed by the red dye for example), specially true if thick sections. (Definitely avoid triple filters if have bleed though.) Kenton Kenton Arkill GB U23 Ladies' Underwater Hockey Coach On 25 Jun 2012, at 19:05, gizem wrote: > we have a color camera to capture images > the sample is dual labeled green and red > the filters collect green-red and red only channels > tried to subtract red from green-red to get green only signal > but that did not work well any suggestions are welcome > > -- > View this message in context: http://imagej.1557.n6.nabble.com/Filter-problem-tp4999173p4999195.html > Sent from the ImageJ mailing list archive at Nabble.com. > > -- > ImageJ mailing list: http://imagej.nih.gov/ij/list.html -- ImageJ mailing list: http://imagej.nih.gov/ij/list.html |
Re: 3 D tracking problem of fish
|
|
In reply to this post by Przemko
Hi Przemko
Assuming your control group and your treatment group are in two different videos (or can be separated as two different videos), and assuming that all you need is to have the "cloud" and then measure its diameter, then there may be very easy way to go (without having to actually track them); (1) convert your video to a stack of images (2) some processing of these images* (3) project the whole sequence into a single image (Image-Stack-Z project) using "Max intensity" (if your fishes are lighter than the background, or "Min intensity" if your fishes are dark objects in a light background). With step (3) you get the clouds, and then you measure the diameter and compare it with the diameter of the cloud of the control group. Cheers, Rodrigo ________________________ Rodrigo J. Gonçalves ________________________ >________________________________ > From: Przemko <[hidden email]> >To: [hidden email] >Sent: Monday, June 25, 2012 9:40 AM >Subject: 3 D tracking problem of fish > >Hi there. I did some searching to try to resolve the issue described below but failed to find a reasonable answer. So, here is my problem. I have 4 fish in a tank. In one part of the tank are some plants giving them protection. The fish, per tank, are exposed to a chemical and I follow their reaction. Specifically, I measure how far do they get out of their hideout. The hypothesis is that depending on the chemical they will go further away form the hideout as compared to the control group. What I do MANUALLY right now is watch the video and measure on the screen the distance, make Excel sheet and do the statistics. Clearly this is the most inefficient way to go, especially since I have more than 1000h video. >I looked at Multitracker and other plugins but none of them will do the job I described above. Ideally, what I would like is to have a "cloud" of the tracks with the hideout as the center. I could measure then the diameter of the "cloud" and compare. > >Can anyone point me in the right direction? > >Thank you!!! > >Przemko > > > >-- Przemko Tylzanowski PhD >Dept. Development and Regeneration >LSD& Joints >ON1 box 813 >University of Leuven >Herestraat 49 >3000 Leuven >Belgium >phone: +32-16-34-61-96 >fax : +32-16-34-62-00 > >-- >ImageJ mailing list: http://imagej.nih.gov/ij/list.html > > > -- ImageJ mailing list: http://imagej.nih.gov/ij/list.html |
«
Return to ImageJ
|
1 view|%1 views
| Free forum by Nabble | Edit this page |