Finding Multiple Peaks in a Plot Profile
|
This post was updated on .
Hello,
this is my first post in this forum and I'm not very experienced with ImageJ. I've been looking for help with a particular problem where I'll probably be using the Plot Profile of an image. The following is an example of the raw image I'll be using: 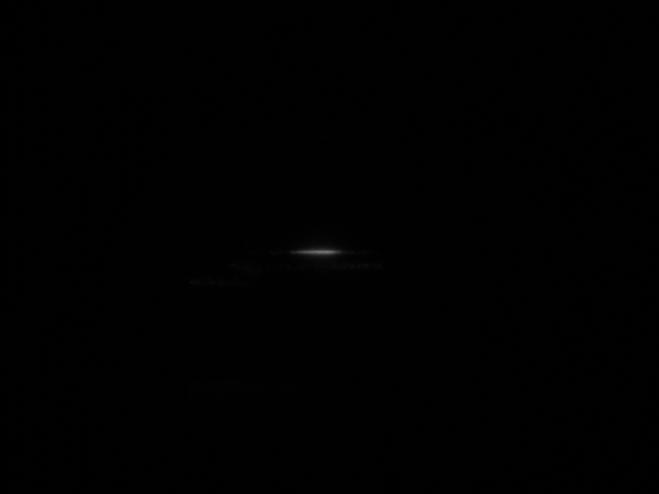 This one is basicly the same, but I adjusted the contrast a little so you can better see what's happening. 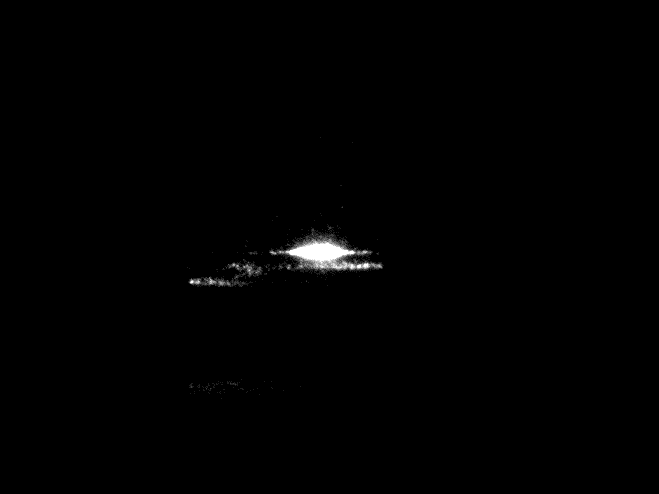 When I generate the Plot Profile of that image using control+alt+k (I specifically need this one, not the one using control+k), I get this: 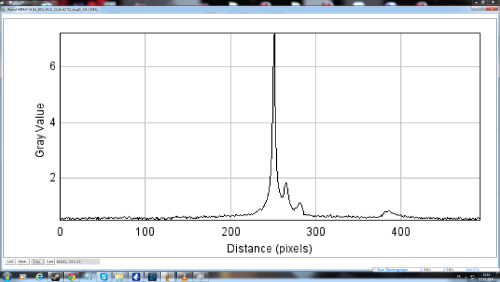 What I'm finally looking for is a way to reliably find the positions (or more specifically the x-coordinates) of these peaks in whatever Plot Profile I generate. There is a different number and height of peaks depending on each picture. 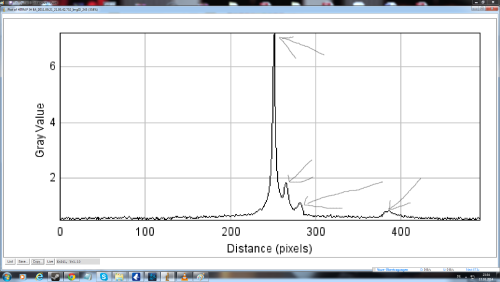 My first guess was to use the fitting tool of ImageJ, but it seems to be too limited to use it for this task. I'm not even sure if fitting would be necessary at all. I would be very thankful for any suggestions on how to go about this problem. I uploaded the raw image below. Thanks in advance to anyone, who might help me. HITRAP_IH_EA_2011.09.21_21.05.42.752_ImgID_245.png |
Re: Finding Multiple Peaks in a Plot Profile
|
You might try the Beanshell script here (http://fiji.sc/Find_Peaks) in FIJI.
George On Mon, Mar 17, 2014 at 6:51 PM, Burni <[hidden email]> wrote: > Hello, > > this is my first post in this forum and I'm not very experienced with > ImageJ. > I've been looking for help with a particular problem where I'll probably be > using the Plot Profile of an image. > The following is an example of the raw image I'll be using: > > < > http://imagej.1557.x6.nabble.com/file/n5006959/HITRAP_IH_EA_2011.09.21_21.05.42.752_ImgID_245.png > > > > This one is basicly the same, but I adjusted the contrast a little so you > can better see what's happening. > > < > http://imagej.1557.x6.nabble.com/file/n5006959/HITRAP_IH_EA_2011.09.21_21.05.42.752_ImgID_245_Edit.png > > > > When I generate the Plot Profile of that image using control+alt+k (I > specifically need this one, not the one using control+k), I get this: > > <http://imagej.1557.x6.nabble.com/file/n5006959/PlotProfile.png> > > What I'm finally looking for is a way to reliable find the positions (or > more specifically the x-coordinates) of these peaks in whatever Plot > Profile > I generate. There is a different number and height of peaks depending on > each picture. > > <http://imagej.1557.x6.nabble.com/file/n5006959/PlotProfile_Peaks.png> > > My first guess was to use the fitting tool of ImageJ, but it seems to be > too > limited to use it for this task. > I'm not even sure if fitting would be necessary at all. > I would be very thankful for any suggestions on how to go about this > problem. > I uploaded the raw image below. > > Thanks in advance to anyone, who might help me. > > HITRAP_IH_EA_2011.09.21_21.05.42.752_ImgID_245.png > < > http://imagej.1557.x6.nabble.com/file/n5006959/HITRAP_IH_EA_2011.09.21_21.05.42.752_ImgID_245.png > > > > > > -- > View this message in context: > http://imagej.1557.x6.nabble.com/Finding-Multiple-Peaks-in-a-Plot-Profile-tp5006959.html > Sent from the ImageJ mailing list archive at Nabble.com. > > -- > ImageJ mailing list: http://imagej.nih.gov/ij/list.html > -- ImageJ mailing list: http://imagej.nih.gov/ij/list.html |
|
I'm going to sleep for today, but this looks very close to what I'm trying to do.
I'll be looking into it tomorrow, thank you for your fast response! Good night everyone. |
|
This post was updated on .
In reply to this post by George Patterson
Hi again,
so I took the time to look through the script and experiment with some images. It seems to work very well for what I have in mind. Do you know if there is a documentation about how the program is finding the peaks exactly? I'm not talking about a manual, I'm just interested about the method the script is using. I did some thinking and from my interpretation, the best results would be achieved if the individual peaks were the result of a Gaussian or a Lorentz fit (so instead of the absolute peak, I would be looking for the mean of the fitted density function), rather than just searching for the highest points of the curve. Do you know if the script works like that or maybe if there's an addon or script that does? In any case, this script is already helping me a lot, so thanks. |
Re: Finding Multiple Peaks in a Plot Profile
|
On Mar 18, 2014, at 06:28, Burni <[hidden email]> wrote:
> how the program is finding the peaks exactly? Peak detection is performed by MaximumFinder, the plugin that implements the Process>Find Maxima... command. The source code is here: http://imagej.nih.gov/ij/developer/source/ij/plugin/filter/MaximumFinder.java.html This is possible because last year Norbert Vischer made MaximumFInder aware of 1D arrays. > The best results would be achieved if the individual peaks were the result of a > Gaussian or a Lorentz fit (...) Do you know if there's an addon or script that > does this? Perhaps you could use the built-in CurveFitter (Analyze>Tools>Curve Fitting...)? In a macro: run("Blobs (25K)"); makeLine(132, 12, 143, 33); run("Plot Profile"); Plot.getValues(x, y); Fit.doFit("Gaussian", x, y); Fit.plot(); Best, -tiago -- ImageJ mailing list: http://imagej.nih.gov/ij/list.html |
Re: Finding Multiple Peaks in a Plot Profile
|
You could also have a look at Norbert Vischer's peak finder macro.
http://simon.bio.uva.nl/objectj/examples/PeakFinder/peakfinder.html It does what you expect. Jerome. On 18 March 2014 13:45, Tiago Ferreira <[hidden email]>wrote: > On Mar 18, 2014, at 06:28, Burni <[hidden email]> wrote: > > how the program is finding the peaks exactly? > > Peak detection is performed by MaximumFinder, the plugin that implements > the > Process>Find Maxima... command. The source code is here: > > http://imagej.nih.gov/ij/developer/source/ij/plugin/filter/MaximumFinder.java.html > This is possible because last year Norbert Vischer made MaximumFInder > aware of 1D > arrays. > > > > The best results would be achieved if the individual peaks were the > result of a > > Gaussian or a Lorentz fit (...) Do you know if there's an addon or > script that > > does this? > Perhaps you could use the built-in CurveFitter (Analyze>Tools>Curve > Fitting...)? > > In a macro: > > run("Blobs (25K)"); > makeLine(132, 12, 143, 33); > run("Plot Profile"); > Plot.getValues(x, y); > Fit.doFit("Gaussian", x, y); > Fit.plot(); > > Best, > -tiago > -- > ImageJ mailing list: http://imagej.nih.gov/ij/list.html > -- Jerome Mutterer CNRS - Institut de biologie moléculaire des plantes 12, rue du Général Zimmer 67084 Strasbourg Cedex T 0367155339 www.ibmp.cnrs.fr -- ImageJ mailing list: http://imagej.nih.gov/ij/list.html |
|
In reply to this post by Tiago Ferreira-2
Hello Tiago,
thank you for your response. I didn't realize you could also do a Plot Profile of a specified line. This looks very helpful. I tried working with the fitting tool and it works ok as long as the Plot Profile of my image contains only a single peak. What I'm trying to do is write a program (or Makro) which does a Plot Profile of the whole image and fits each peak that occurs. What I can also imagine is isolating the regions which form the peaks and then fitting them individually. For example this part would form the big peak of my Plot Profile of the entire image. 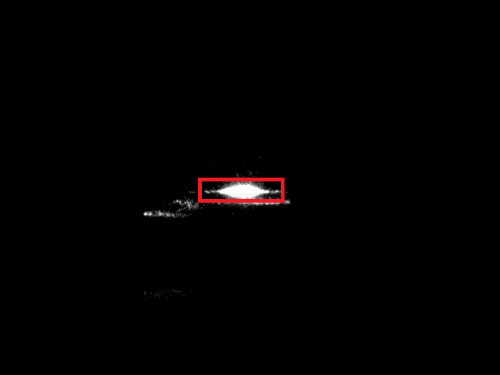 But for now, I only know how to do that manually (as in putting a region of interest around them by hand and doing a Plot Profile of that which I can then fit). Is there a way to seperate these regions automatically? Fitting them afterwards wouldn't be a problem. Another thing that comes to mind is multifitting as you can do in Origin for example, but ImageJ doesn't seem to support that (at least not in the standard curve fitting tool). |
|
In reply to this post by Jerome Mutterer-3
Thank you Jerome, I'll be testing that Makro aswell.
|
Re: Finding Multiple Peaks in a Plot Profile
|
In reply to this post by Jerome Mutterer-3
Hi Burni, Tiago, Jerome, Geroge,
Another possibility is to use R package Multi-Peak fitter from ImageJ. http://cmci.embl.de/documents/120206pyip_cooking/python_imagej_cookbook#rmulti-peak_fitting_using_r Cheers, Kota On Tue, Mar 18, 2014 at 2:29 PM, Jerome Mutterer < [hidden email]> wrote: > You could also have a look at Norbert Vischer's peak finder macro. > http://simon.bio.uva.nl/objectj/examples/PeakFinder/peakfinder.html > It does what you expect. > > Jerome. > > > > > On 18 March 2014 13:45, Tiago Ferreira <[hidden email] > >wrote: > > > On Mar 18, 2014, at 06:28, Burni <[hidden email]> wrote: > > > how the program is finding the peaks exactly? > > > > Peak detection is performed by MaximumFinder, the plugin that implements > > the > > Process>Find Maxima... command. The source code is here: > > > > > http://imagej.nih.gov/ij/developer/source/ij/plugin/filter/MaximumFinder.java.html > > This is possible because last year Norbert Vischer made MaximumFInder > > aware of 1D > > arrays. > > > > > > > The best results would be achieved if the individual peaks were the > > result of a > > > Gaussian or a Lorentz fit (...) Do you know if there's an addon or > > script that > > > does this? > > Perhaps you could use the built-in CurveFitter (Analyze>Tools>Curve > > Fitting...)? > > > > In a macro: > > > > run("Blobs (25K)"); > > makeLine(132, 12, 143, 33); > > run("Plot Profile"); > > Plot.getValues(x, y); > > Fit.doFit("Gaussian", x, y); > > Fit.plot(); > > > > Best, > > -tiago > > -- > > ImageJ mailing list: http://imagej.nih.gov/ij/list.html > > > > > > -- > Jerome Mutterer > CNRS - Institut de biologie moléculaire des plantes > 12, rue du Général Zimmer > 67084 Strasbourg Cedex > T 0367155339 > www.ibmp.cnrs.fr > > -- > ImageJ mailing list: http://imagej.nih.gov/ij/list.html > -- -------------------------------------------------------------*Dr. Kota Miura* Scientist & IT Engineer Centre for Molecular and Cellular Imaging, European Molecular Biology Laboratory Meyerhofstr. 1 69117 Heidelberg GERMANY Tel +49 6221 387 404 Mobile +49 160 95001177 Fax +49 6221 387 512 http://cmci.embl.de ------------------------------------------------------------- -- ImageJ mailing list: http://imagej.nih.gov/ij/list.html |
Re: Finding Multiple Peaks in a Plot Profile
|
In reply to this post by Burni
Hi Burni,
here is an idea for a different approach: - Duplicate the image and smooth it (if it is just 8 bits like your example, convert it to float before). On the example, the 'mean' or 'border limited mean' of the Fast Filters plugin with a radius of 5 in x and 1 in y may be reasonable. Maybe smooth twice. - Run 'Find Maxima' with suitable tolerance to find the maxima (use preview), output type List (i.e., Results Table). - On the original image, create a rectangle of fixed width (rather large) and height (rather small) for each, do a profile and fit it. All this can be automated in a macro. - It may happen that rectangles overlap. The 'Find Maxima' output is sorted in descending height. So, after creating a profile for each rectangle, you might set the pixel values to NaN (not a number; needs a float image). In the line profile, you have to eliminate the NaN's before fitting. This is a crude way of avoiding too much influence of a large peak on the small one. Of course, it does not account for overlapping peaks, where you would have to subtract one from the other. -- Already a while ago, I thought about adding a 'double Gaussian' fit to ImageJ (with and without constant background). The problem is finding suitable starting values; without them such a fit will usually fail. If someone knows a good algorithm that also works with overlapping peaks, let me know! -- Another thought: If all your peaks should have the same shape (instrument response function, etc), it is actually a deconvolution problem, and you might try various deconvolution plugins. -- By the way, when cranking up the contrast your images show a pattern of parallel (roughly diagonal) stripes, and also other spots in the FFT. Also the peaks seem to be modulated by this periodicity. It would be good to get rid of such artifacts, that would make peak fitting easier! Michael ________________________________________________________________ On Mar 17, 2014, at 23:51, Burni wrote: > Hello, > > this is my first post in this forum and I'm not very experienced with > ImageJ. > I've been looking for help with a particular problem where I'll probably be > using the Plot Profile of an image. > The following is an example of the raw image I'll be using: > > <http://imagej.1557.x6.nabble.com/file/n5006959/HITRAP_IH_EA_2011.09.21_21.05.42.752_ImgID_245.png> > > This one is basicly the same, but I adjusted the contrast a little so you > can better see what's happening. > > <http://imagej.1557.x6.nabble.com/file/n5006959/HITRAP_IH_EA_2011.09.21_21.05.42.752_ImgID_245_Edit.png> > > When I generate the Plot Profile of that image using control+alt+k (I > specifically need this one, not the one using control+k), I get this: > > <http://imagej.1557.x6.nabble.com/file/n5006959/PlotProfile.png> > > What I'm finally looking for is a way to reliable find the positions (or > more specifically the x-coordinates) of these peaks in whatever Plot Profile > I generate. There is a different number and height of peaks depending on > each picture. > > <http://imagej.1557.x6.nabble.com/file/n5006959/PlotProfile_Peaks.png> > > My first guess was to use the fitting tool of ImageJ, but it seems to be too > limited to use it for this task. > I'm not even sure if fitting would be necessary at all. > I would be very thankful for any suggestions on how to go about this > problem. > I uploaded the raw image below. > > Thanks in advance to anyone, who might help me. > > HITRAP_IH_EA_2011.09.21_21.05.42.752_ImgID_245.png > <http://imagej.1557.x6.nabble.com/file/n5006959/HITRAP_IH_EA_2011.09.21_21.05.42.752_ImgID_245.png> > > > > -- > View this message in context: http://imagej.1557.x6.nabble.com/Finding-Multiple-Peaks-in-a-Plot-Profile-tp5006959.html > Sent from the ImageJ mailing list archive at Nabble.com. > > -- > ImageJ mailing list: http://imagej.nih.gov/ij/list.html -- ImageJ mailing list: http://imagej.nih.gov/ij/list.html |
|
Hi Kota and Micheal,
thank you for your input. I hope I'll be able to test the different approaches that have been suggested so far in the next days. Again, thanks to anyone who has been contributing so far! Burni |
«
Return to ImageJ
|
1 view|%1 views
| Free forum by Nabble | Edit this page |

