Hi,
First post as i'm struggling with something i think is fairly basic.
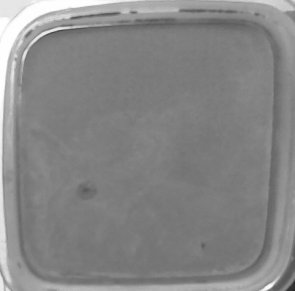
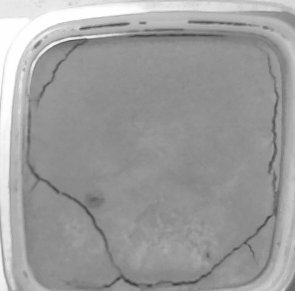
I have a stack of 1000 images that are timelapse images of a soil drying. I want to measure the area of the surface cracks as they progressively get larger with time (as the soil dries). I am convinced i can do this analysis with ImageJ. Of the various histogram/intensity analyses, i have not been able to do this successfully. Here is a start and final image. I have them in RGB, but i converted to greyscale as i had problems with the Threshold function working correctly.


I'd like a simple graph of the increase in area of the cracks compared to the entire soil surface over time. I guess its just a sort of Batch Statistics function that i can copy into Excel for each slice and graph from there.
Any help would be greatly appreciated.