Want to create a map of pressure from image
|
Hi all.
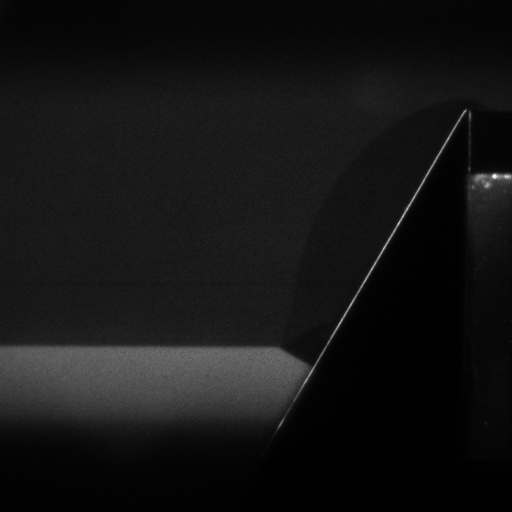
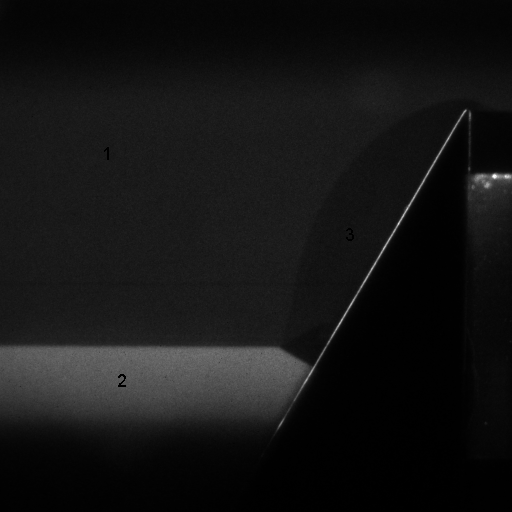
I have the following image:  For the processing I need to do on it, I need to divide it up into clearly demarcated sections that I can define a pressure for. I was thinking of doing this by setting the intensity values in certain regions to 1, 2, 3, or 4, then later in my postprocessing I can simply say something along the lines of: if intensity = 1, pressure = 1atm, etc. i.e.:  Now, I can manually draw polygons and fill them with the desired intensity, but I'd prefer a way to use the lines dividing the section in the existing image. I was thinking perhaps smoothing the image somewhat then using edge detection, but I can't figure out how to then fill within the boundaries defined by the edge. If anyone could direct me to a better way than simply drawing in and filling polygonal sections, I'd be most appreciative. Best Regards Daniel |
|
Hi,
On Mon, 24 May 2010, DMItchell wrote: > I have the following image: > > http://imagej.588099.n2.nabble.com/file/n5096674/shock24.png > > For the processing I need to do on it, I need to divide it up into > clearly demarcated sections that I can define a pressure for. > > I was thinking of doing this by setting the intensity values in certain > regions to 1, 2, 3, or 4, then later in my postprocessing I can simply say > something along the lines of: if intensity = 1, pressure = 1atm, etc. > > i.e.: http://imagej.588099.n2.nabble.com/file/n5096674/labelledshock.png > > > Now, I can manually draw polygons and fill them with the desired > intensity, but I'd prefer a way to use the lines dividing the section in > the existing image. I was thinking perhaps smoothing the image somewhat > then using edge detection, but I can't figure out how to then fill > within the boundaries defined by the edge. > > > If anyone could direct me to a better way than simply drawing in and > filling polygonal sections, I'd be most appreciative. I played with your image for a few minutes, and the following strategy seemed promising: Image>Type>8-bit Plugins>Process>Bilateral Filter, radius 9, range 50 Plugins>Segmentation>Statistical Region Merging, leave Q=25 For obvious reasons, I did the analysis in Fiji (http://pacific.mpi-cbg.de/) which has the Bilateral Filter and the Statistical Region Merging plugins. The Bilateral Filter is an edge-preserving smooth procedure similar to the Sigma Filter, which copes with the noise you have in those images. Maybe an even larger radius and even smaller range would make results better, but I leave that experimentation to you. The Statistical Region Merging is a very cool algorithm to turn connected regions of roughly the same brightness/color into segmented images. For the processing you have in mind, you probably want to turn off the "Show average" option; the result will then be indices 0, 1, 2, ... for the different regions, rather than average intensities. Ciao, Johannes |
«
Return to ImageJ
|
1 view|%1 views
| Free forum by Nabble | Edit this page |

