Hello,
I recently stained spinal cord sections with H&E and performed IHC to look at NeuN, GFAP, and ED1. There is no difference between my negative control group and experimental group in any of the four stains; however, I need to quantify something to 'prove' there is no difference. Since there are no positive cells to count, my advisor suggested using ImageJ to show that the intensity varies across each spinal cord in the same manner for each group. Has anyone done this before? I realize intensity analysis is not proper quantification for IHC, but we are merely trying to show that the groups are the same quantitatively. Is there a way to define a certain-sized rectangle (and save the dimensions) that will span horizontally across the spinal cord then tell ImageJ to measure the intensity every so many mm, for example (i.e., showing the intensity changes from white matter to gray matter to white matter)? Thank you, in advance, for your help! |
Hi,
Intensity measurements in this case would be very wrong indeed. Why don't you try the color deconvolution plugin (there is a preset for H&E with DAB and other popular stains as well). Then you can show that there are no differences between the different specimens in the mean area fraction occupied by the "positive" channel of every nth slice ( the mean area fraction is actually equal to the volumetric fraction in the sampled volume) . It is not the best approach but seems more legit than the intensity measurements on the H&E/IHC stained slices as it is about comparison and not absolute values (the errors and bias introduced would be similar in the different specimens). Best of luck! Stoyan 2013/2/11 jbell <[hidden email]> > Hello, > > I recently stained spinal cord sections with H&E and performed IHC to look > at NeuN, GFAP, and ED1. There is no difference between my negative control > group and experimental group in any of the four stains; however, I need to > quantify something to 'prove' there is no difference. > > Since there are no positive cells to count, my advisor suggested using > ImageJ to show that the intensity varies across each spinal cord in the > same > manner for each group. Has anyone done this before? I realize intensity > analysis is not proper quantification for IHC, but we are merely trying to > show that the groups are the same quantitatively. > > Is there a way to define a certain-sized rectangle (and save the > dimensions) > that will span horizontally across the spinal cord then tell ImageJ to > measure the intensity every so many mm, for example (i.e., showing the > intensity changes from white matter to gray matter to white matter)? > > Thank you, in advance, for your help! > > > > -- > View this message in context: > http://imagej.1557.n6.nabble.com/quantification-of-IHC-intensity-no-positive-cells-to-count-tp5001725.html > Sent from the ImageJ mailing list archive at Nabble.com. > > -- > ImageJ mailing list: http://imagej.nih.gov/ij/list.html > -- Dr. Stoyan P. Pavlov, MD, PhD Departament of Anatomy, Histology and Embryology Medical University "Prof. Dr. Paraskev Stoyanov", Varna Prof. Marin Drinov Str.55 9002 Varna Bulgaria Tel: +359 (0) 52 - 677 - 086 e-mail: [hidden email] -- ImageJ mailing list: http://imagej.nih.gov/ij/list.html |
Hi Stoyan!
Thank you for the input! Do you have a written step-by-step protocol detailing what you described that you could provide to me (i.e, how to take 'n' slices, etc.) ? If not, do you know where I could find one? Thank you! Jenny |
Dear Jenny,
I do not have a protocol and you will need to adjust the the software's parameters for your images . A little bit trial and error might be needed. Once you are able to separate correctly the H, E and DAB channels on your pictures (I assume you are using DAB) all you have to do is run Measure with Area and area fraction set in the Set Measurements menu and Limit to threshold option checked. Once you finish the measurements you can calculate the average area fraction per image (this is actually the volumetric fraction per sampled volume). There are many approaches to chose the number N of slices to sample. One easy way is to decide what fraction of your specimen you will sample. Than after you cut serially your entire specimen you divide the number of received slices by the denominator and round up to an integer. That integer is actually your number N and you need to chose every Nth slice in the series (it is not necessery to start from the first slide).. E.g. you decide to sample 1/10 of the specimen and after the serial sectioning you received 234 slices. You will need to image every 23rd slice for your measurement ( that is either № 1,24, 47 etc or № 3, 26,49 etc.; once again it doesn't matter where you start.) It is important however that all specimens are be sampled in the same way ( same fraction of slices, i.e. if your other spevcimen produces 256 slices you will need to sample every 25th). 
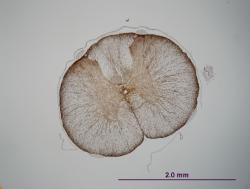
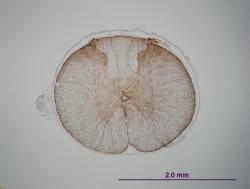
I am not really sure if this will be helpful to you, but if you could provide sample images others might be able to give you a better advice. Best luck! 2013/2/11 jbell <[hidden email]> > Hi Stoyan! > > Thank you for the input! Do you have a written step-by-step protocol > detailing what you described that you could provide to me (i.e, how to take > 'n' slices, etc.) ? If not, do you know where I could find one? > > Thank you! > Jenny > > > > -- > View this message in context: > http://imagej.1557.n6.nabble.com/quantification-of-IHC-intensity-no-positive-cells-to-count-tp5001725p5001729.html > Sent from the ImageJ mailing list archive at Nabble.com. > > -- > ImageJ mailing list: http://imagej.nih.gov/ij/list.html > -- Dr. Stoyan P. Pavlov, MD, PhD Departament of Anatomy, Histology and Embryology Medical University "Prof. Dr. Paraskev Stoyanov", Varna Prof. Marin Drinov Str.55 9002 Varna Bulgaria Tel: +359 (0) 52 - 677 - 086 e-mail: [hidden email] -- ImageJ mailing list: http://imagej.nih.gov/ij/list.html |
Okay, I think I misunderstood what you were referring to in terms of setting 'n' slices. I was referring to the number of 'slices' or sections that will be analyzed in ImageJ across a given spinal cord... basically to get a survey of both the white and gray matter.
See example GFAP sections below... I need a way to show that there is no difference between the two cords (there are no GFAP-positive cells in either cord). The overall intensity is different in each cord because of how the cords were handled during the staining process. (The antibody incubation times, etc. were the same, but some slides inevitably sat a few extra seconds in antibody, etc. since they were rinsed last, etc.) Since counting cells is not an option, how could I show no biologically-relevant difference while taking into account the overall intensity difference (if that makes any sense)? ![]() ![]() |
Free forum by Nabble | Edit this page |