I am curious whether other people think this would work where the final plot could be converted to vessel wall width by
1_pixel_intensity = 255 / lineWidth
so if a line width were 49 pixels, then 1 pixel wide wall would be an intensity of 5.2 and a 3 pixel wide wall would be approx 15.6.
selectWindow("5a-72h-crop.jpg");
run("Split Channels");
selectWindow("5a-72h-crop.jpg (blue)");
close();
selectWindow("5a-72h-crop.jpg (red)");
close();
selectWindow("5a-72h-crop.jpg (green)");
run("Median...", "radius=3");
//run("Threshold...");
setAutoThreshold("Huang dark");
setThreshold(35, 255);
run("Convert to Mask");
run("Duplicate...", "title=[5a-72h-crop.jpg (green)-1]");
run("Skeletonize");
//setTool("polyline"); linewidth also set to 49
makeLine(150,164,181,179,197,201,219,207,247,195,257,163,253,134,237,104,229,98,206,76,200,60,168,43,145,46,104,38,81,40,59,40,38,64,29,92,33,113,48,144);
selectWindow("5a-72h-crop.jpg (green)");
run("Restore Selection");
run("Plot Profile");
________________________________________________________
Michael Cammer, Assistant Research Scientist
Skirball Institute of Biomolecular Medicine
Lab: (212) 263-3208 Cell: (914) 309-3270
-----Original Message-----
From: ImageJ Interest Group [mailto:
[hidden email]] On Behalf Of Duvaraka
Sent: Monday, March 04, 2013 7:53 AM
To:
[hidden email]
Subject: varying length thickness measure module
Hi
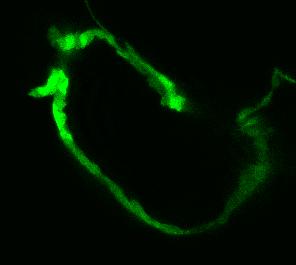
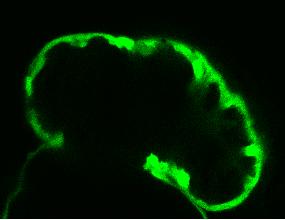
I I would like to measure average thickness of ventricle walls and I could do this with a line tool, measuring length. However I want to take into account that in some ventricles the length is more variable due to projections (maximum areas of thickness) and in other ventricles the thickness is more even and has fewer projections.
Is there a way to do this by drawing a box around selected areas and taking into account how much of the thickness is a larger length with more projections, in comparison to a ventricle with fewer projections? So that you would obtain a graph showing changes in thickness over a region of interest and the average wouldn't be in the middle of the maximum and minimum thickness, but an average skewed towards whether there are more thicker projections present in the image or thinner areas?
<
http://imagej.1557.n6.nabble.com/file/n5001983/2b-72h-crop.jpg>
<
http://imagej.1557.n6.nabble.com/file/n5001983/5a-72h-crop.jpg>
--
View this message in context:
http://imagej.1557.n6.nabble.com/varying-length-thickness-measure-module-tp5001983.htmlSent from the ImageJ mailing list archive at Nabble.com.
--
ImageJ mailing list:
http://imagej.nih.gov/ij/list.html--
ImageJ mailing list:
http://imagej.nih.gov/ij/list.html