Hi Paul,
Maybe you can have a look to this page for how to manage 3D objects and
distances :
http://imagejdocu.tudor.lu/doku.php?id=plugin:stacks:3d_roi_manager:startthere is a simple macro on how to do basic clustering in 3D.
best,
Thomas
Le 21/07/2012 12:08, pauliehagan a écrit :
> Hello list,
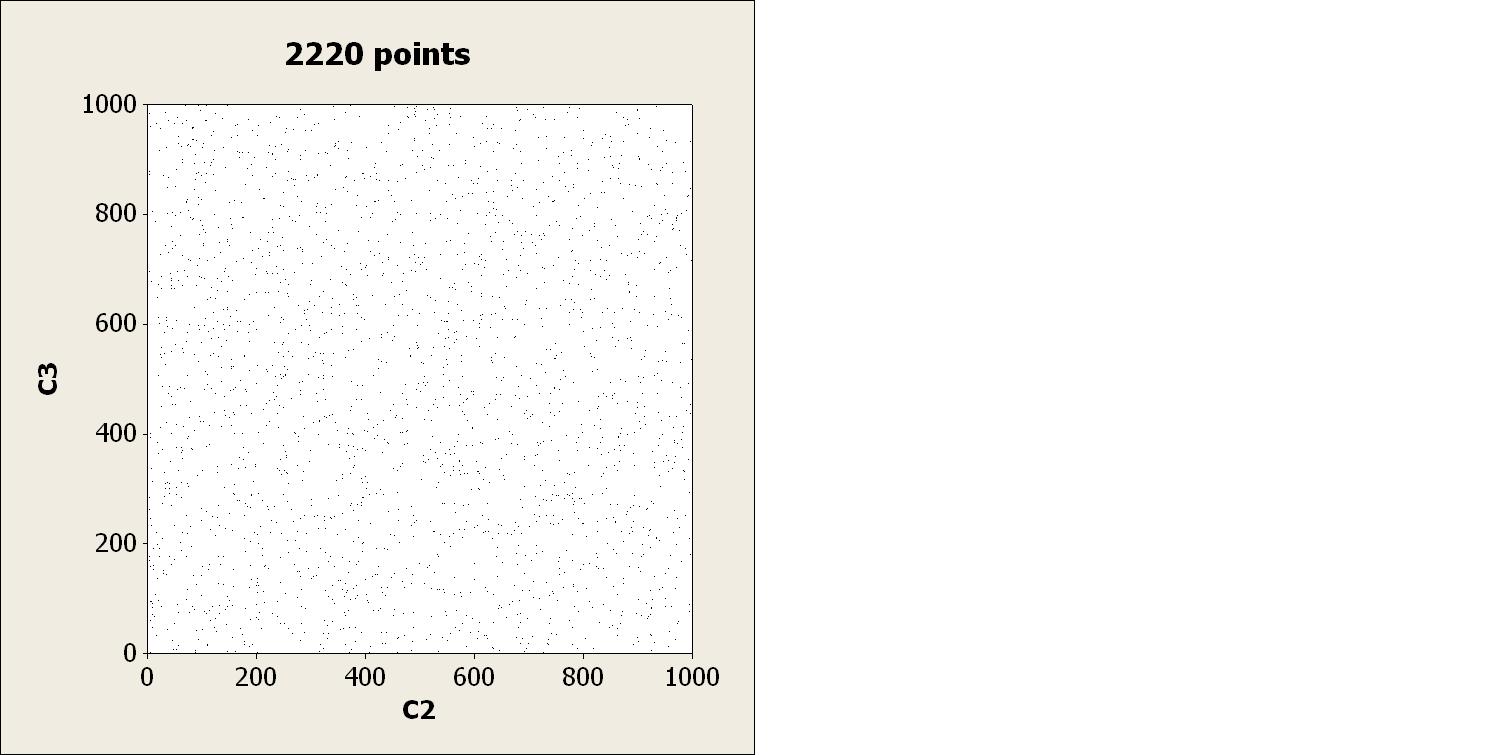
> We are new to imagej and over the last few weeks have been testing the graph
> plugin to identify clumps or clusters of points on a plane. The points are
> randomnly generated (by a variety of methods) x y coordinates plotted on a
> conventional x y scatter plot (this is the image we analyze, attached if my
> explanation is nonsense). We use the graph plugin after analyze particle to
> generate a list of the clusters and the points which make up each cluster.
> We can then compare this with statistical models which attempt to predict
> the number of clusters with 1, 2, 3, 4, ...............n membership.
> The output produced by the graph plugin is perfect as we can easily process
> the log in excel to identify the number of 1's 2's 3's etc. Then compare
> this with theory.
> So far so good, the 2D picture is working out a treat.
> Next stage is the analysis in 3D. It has been suggested that a simple
> modification of the graph plugin will do the job.
> We have our list of x.y and z coordinates from the randomn generators so at
> this point it is not strictly necessary to analyse an image.
> So is anyone aware of a plugin which will do this? or how graph might be
> modified to perform the 3D analysis? I guess that a 3D image would have to
> be subdivided into thin slices and do the nearest neighbour on each slice
> then put the sliced up volume back together again?
> All this will lead to a better understanding of how clumped nanoparticles
> constitute a greater health hazard than low airborne concentrations of
> single nanoparticles.
>
> Many thanks
> Paul
>
>
http://imagej.1557.n6.nabble.com/file/n4999521/2220_black_circles.jpg>
>
>
> --
> View this message in context:
http://imagej.1557.n6.nabble.com/3D-nearest-neighbours-and-identifying-clumps-clusters-tp4999521.html> Sent from the ImageJ mailing list archive at Nabble.com.
>
> --
> ImageJ mailing list:
http://imagej.nih.gov/ij/list.html>
>
--
/**********************************************************/
Thomas Boudier, MCU Université Pierre et Marie Curie,
Modélisation Cellulaire et Imagerie Biologique (EE1),
IFR 83, Bat B 7ème étage, porte 723, Campus Jussieu.
Tel : 01 44 27 46 92 Fax : 01 44 27 22 91
/*******************************************************/
--
ImageJ mailing list:
http://imagej.nih.gov/ij/list.html